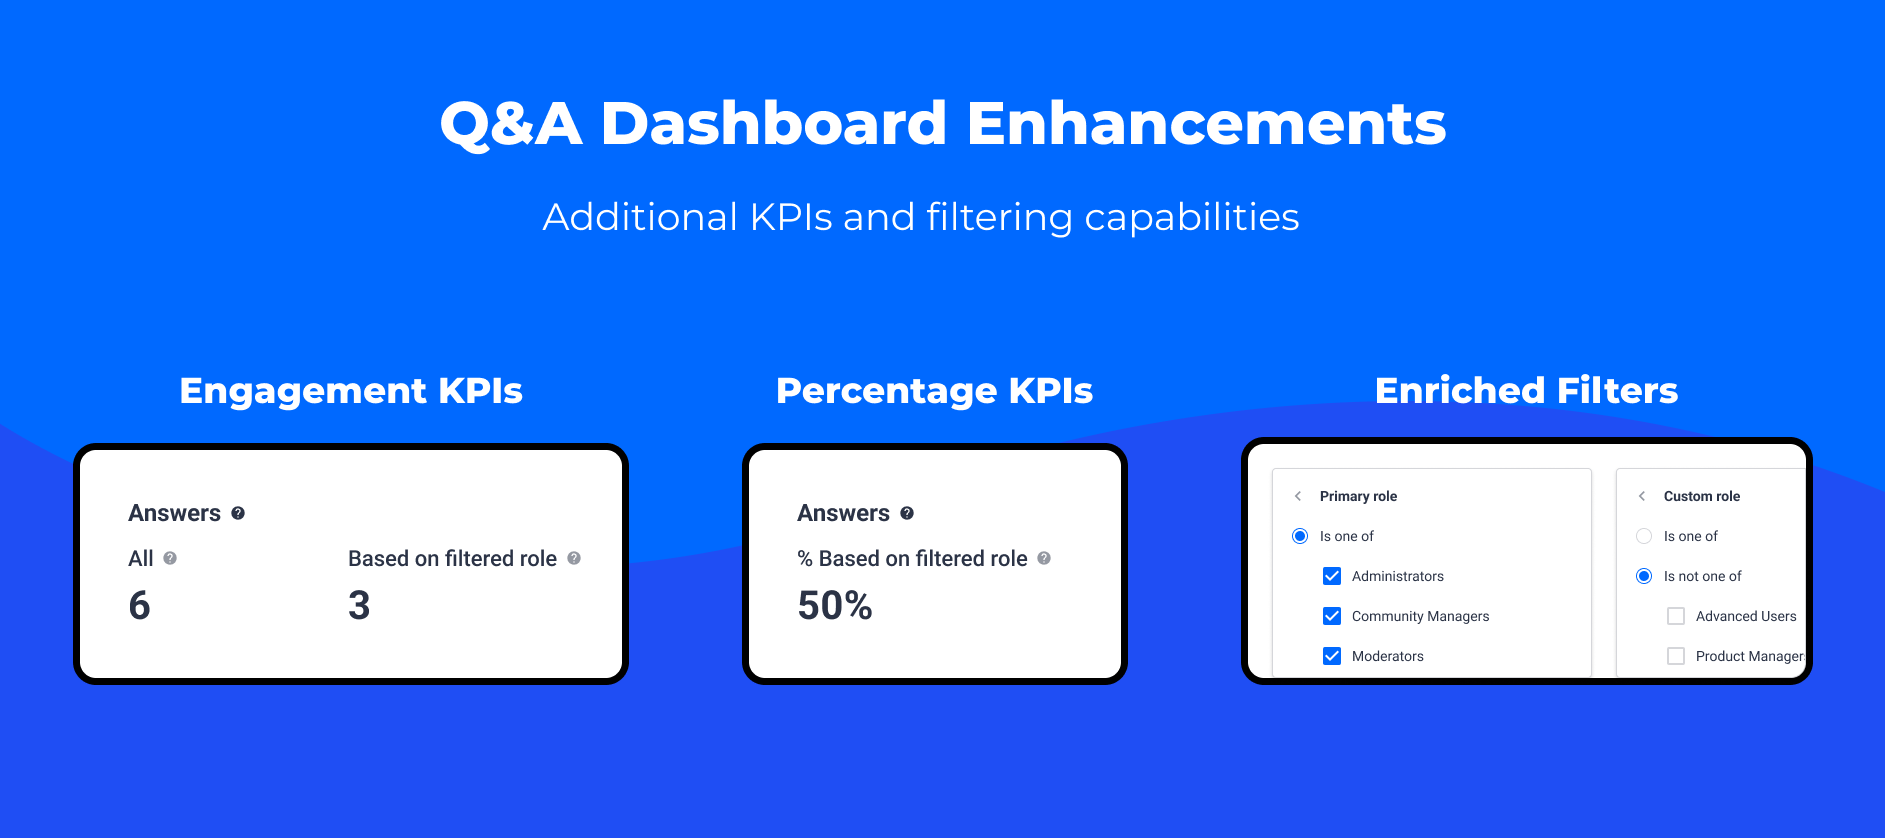
Our goal is to give you the best possible experience with our product and features. We appreciate and are actively listening to all of your feedback. Based on your input, we made a few enhancements to the Q&A Dashboard. These enhancements include:
-
Additional User Engagement KPIs
-
Track user engagement by the number of questions asked and answered in a given timeframe
-
Track user engagement by the number of answers and who was answering
-
-
Enriched user role filters allowing you to exclude roles
-
New Percentage KPIs
Let’s take a closer look at the changes we made.
We added a new Answers section to the Q&A dashboard. This section includes 3 KPIs focused on the answers given in your Q&A module.
-
Answers All
The “Answer All” KPI shows you how many answers were given in a selected time period. We count all replies posted during that time period, which were afterward marked as best answers. We don’t connect these replies with questions.
-
Answers Based on Filtered Role
The “Answers Based on Filtered Role” KPI shows you how many answers were given by users with a specific role selected in the User role answer filter. This enables you to track which users are providing support. You can select from Primary roles and from Custom roles. You also have the ability to exclude roles by using the enhanced user role filters described below.
-
Answers % Based on Filtered Role
The “Answers % Based on Filter Role” KPI shows you the percentage of answers given by selected roles (User role answer filter) among all Answers given in a selected time period. Drill down using the enhanced filters below to determine user support by custom roles.
Formula: Answers Based on Filtered Role / All Answers * 100
Note: If you use the User role answer filter and select Registered User and Super User as the Primary roles you will get the same KPI as % answered by peer in the old Success Dashboard.
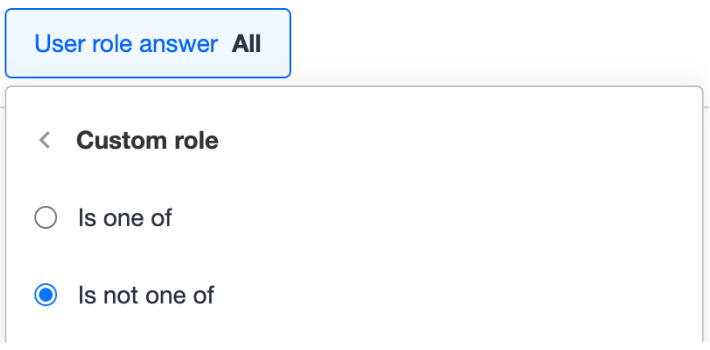
Next, we enriched the user role filters to enable you to exclude users with a given primary and/or custom role.
Each of the user role filters includes the option to filter by Primary role and Custom role using the AND logic between them. Inside each of the user role filters, there are two advanced filtering options:
-
Is one of
-
Is not one of
Finally, we added new question-related percentage KPIs to help you understand and analyze who is asking questions and who is answering them to track support and engagement across your community.
-
% Questions Asked Based on Filtered Role
The “% questions asked based on filtered role” KPI shows you the percentage of questions asked by selected roles (User role question filter) among all Questions asked in a selected time period.
Formula: Questions asked based on filtered role / Questions asked all * 100
-
% Questions answered based on filtered role
The “% questions answered based on filtered role” KPI shows you the percentage of questions asked by selected roles (User role question) in a selected time period that were answered by users with a selected role (User role answer) among all questions asked in that time that have been answered.
Formula: Questions answered based on filtered role / Questions answered all * 100
We’d love to hear your thoughts on the Q&A Dashboard enhancements! As always, if you have any feedback, please add a comment below.
