
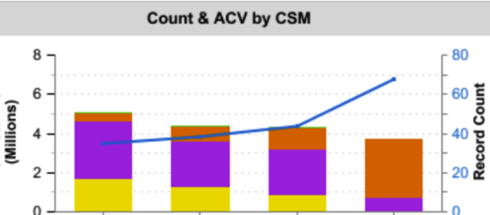
Reports 2.0: Bar & Line Chart

  • February 3, 2016
  • 5 replies
  • 55 views

megan_hamby
It would be great if we could create a report with that totals the sum of ACV a CSM is managing as well as the number of accounts they are managing, similar to the report we have in SFDC (as seen attached).


5 replies

sumesh
  • Helper ⭐️⭐️
  • February 4, 2016
Hi Megan,

You can create this graph in reports 2.0. Steps below

1. Add "ASV" and "id" fields from customer info object to Show me section
2. Add "CSM" field to By section. Report will be rendered by default in tabular format.
3. Select "Column Line" from the visualization options and you should get a report similar to what you've shown.

Please let me know if this doesn't work.

Thanks,
Sumesh 

dstokowski
Forum|alt.badge.img+5
  • Gainsight Employee ⭐️⭐️
  • February 4, 2016
The only piece we do not support today is having the stacked component - you can do column and line but not currently stacked column chart.

megan_hamby
  • Author
  • Contributor ⭐️⭐️⭐️
  • February 4, 2016
Thanks, Sumesh! The only thing that this report lacks is the breakdown of ASV by segment. We use 4 segments to categorize our ASV by size, and if I include that, I cannot view this in the column/line chart. That is why support indicated that I should log an idea. Thanks!

sumesh
  • Helper ⭐️⭐️
  • February 5, 2016
Makes sense, Megan! I'll add your suggestion to the roadmap for prioritisation. 

jeffrey_coleman
Forum|alt.badge.img
If we can expand Megan's request a bit, these combo report types are extremely useful. They could be even more useful!

Stacked or grouped columns would be great. I'd also like to add in multiple lines. My example is to show both the average activity and the standard deviation to determine significance.

As MDA enables more and more useful data, the ability to visualize that and present it in meaningful ways to CSMs is becoming equally critical. Fascinatiung insights that I can't get a CSM to see or understand aren't useful. And when I throw the CTA because the activity level is more than 3 standard deviations away from the average... being able to actually show that quickly moves us from "uh, what?" to "oh, wow!"