
Reports 2.0: Should have the ability to show aggregate total on a graph

  • September 21, 2015
  • 6 replies
  • 38 views

darkknight
Forum|alt.badge.img+5
When I run a report that breaks a particular object (i.e. support cases) down by categories, I still need the sum total to appear somewhere on the graph

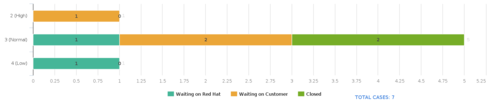
Rough examples attached. 

6 replies

sumesh
  • Helper ⭐️⭐️
  • September 24, 2015
Hi Jeff,

Thanks for your feedback. I've added your suggestion to the roadmap. Timing is TBD.

Thanks,
Sumesh

sumesh
  • Helper ⭐️⭐️
  • October 25, 2015
Hi Jeff,

While we don't display the totals for pie charts, we do display the totals(On selecting show data points from Gear icon|Chart options) for stacked bar and column charts. Can u please cross check and raise an issue if that isn't the case?

Thanks,
Sumesh   

darkknight
Forum|alt.badge.img+5
  • Author
  • Expert ⭐️
  • October 26, 2015
I know you show the totals per bar, but an option to show somewhere on the graph/chart the total...i.e. if it's Support Cases, show the TOTAL support cases overall above or under the legend and then break it down by bar/pie piece.

sumesh
  • Helper ⭐️⭐️
  • October 30, 2015
Thanks for the additional context, Jeff! I will add your suggestion to the roadmap. Actual timing is TBD.

Thanks! 

lauren_marsh
Forum|alt.badge.img
  • Contributor ⭐️⭐️
  • December 11, 2015
This is critical.  Our managers don't want to have to sum up all of the bars in a charts to see the total number of _____ records in the report.

laura_powell
Forum|alt.badge.img
  • Contributor ⭐️⭐️
  • December 10, 2018
I see this is marked implemented- is there a link I can follow to find out more about how it was implemented?