Gainsight Example: Validating Leading Indicators w/ Financial Outcomes (Adoption + Verified Outcomes)

  • 1 September 2023
  • 6 replies
  • 256 views

Userlevel 5
Badge +3

💰 How do you develop confidence in your ability to impact GRR/NRR?
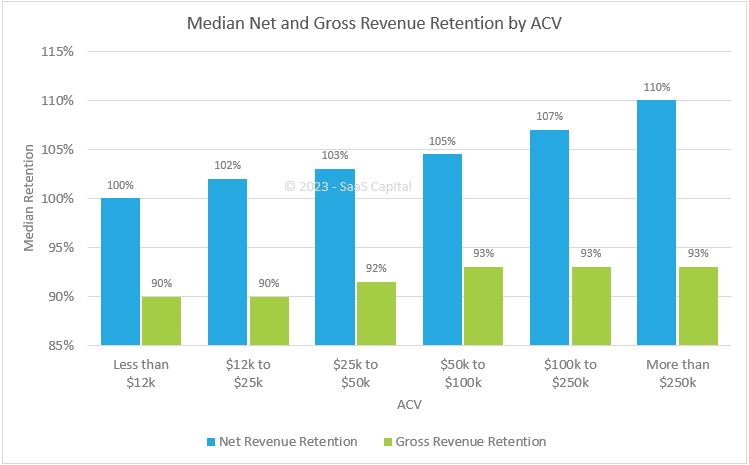
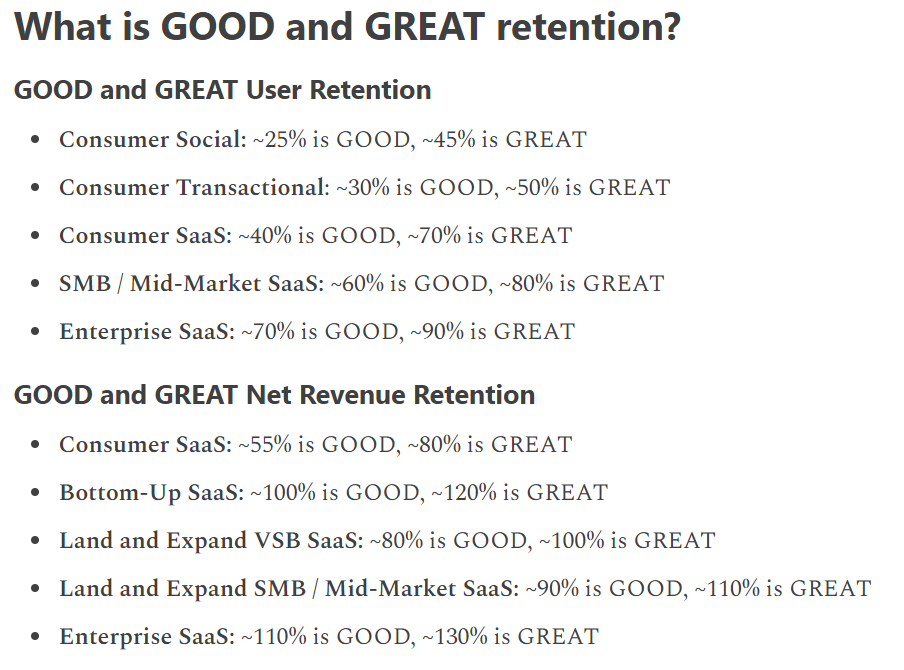
Post-sale teams are tasked with driving GRR and NRR - the key lagging metrics of a SaaS business. If the bucket is too leaky, there’s no way to get off the ground (GRR). And if you can’t consistently expand with customers, you won’t stay in orbit for very long (public company NRR median is ~115%, top quartile is 120%+).

🚦 What are your leading indicators?
What actually impacts these lagging metrics is a question that must be continuously assessed and answered.


Our leading indicators drive our Health Score.  Specifically for measuring outcomes, we use the “DEAR” Framework.  Each measure and threshold is based on correlating performance 6 months before the renewal with the renewal outcome:


At Gainsight, we’ve shifted to re-assessing health scoring to 2x per year vs. annual or more as market conditions change quickly.


📊 What did we learn this quarter about our leading indicators?
We reconfirmed the “recipe” continues to be two key pieces:

  1. Strategic Adoption: Driving the right kind of adoption - using the features that will achieve the customer's goal.
  2. Quantitative Verified Outcome - a statement of ROI by the decision maker - "Because of Gainsight, we have reduced time to resolve risk by 25% leading to a $


📈 Highest GRR Cohort: Customers with High Adoption and 1+ Verified Outcomes
📉 Lowest GRR Cohort: Low Adoption and No Verified Outcomes

💡 Interestingly, Low Adoption w/ VO has higher GRR than High Adoption w/o VO.  Adoption is necessary but not sufficient.

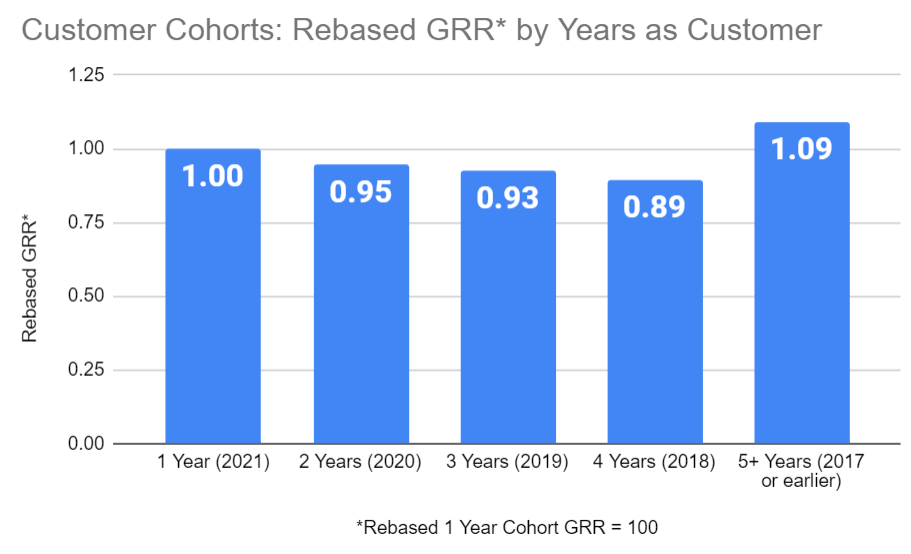
Here's a high level summary of cohort performance!


6 replies

Userlevel 5
Badge +1

Nice analysis @tyler_mcnally . Do you see any differences based on the time since first contract (e.g., churn is higher on first time customers)? Do you take that into account in your analyses?

Userlevel 5
Badge +3

Great question @Jef Vanlaer !​​​​​​

The above analysis does not take years as a customer into account, but we have analyzed in the past.  I think we may refresh the analysis in the next few weeks and ill follow up on this thread!

Related, but slightly different. Something else we track / observe - each year’s cohort should be increasing in GRR - until you get to a “natural GRR” where best in class does seem to correlate with structural factors: Customer Size/ACV, Vertical


Here’s one analysis from SaaS Capital. Ive seen similar versions from other reports as well.


Another example: https://www.lennysnewsletter.com/p/what-is-good-retention-issue-29


Userlevel 5
Badge +1

Thank you for sharing these insights, @tyler_mcnally. I really appreciate this and look forward to learning even more from this type of posts in the future...

Userlevel 5
Badge +3

Hi @Jef Vanlaer,  another friday CS analytics nugged thanks to Carmen Chung at Gainsight!

Note: Rebased the values so Year 1 Cohort GRR = 1; subsequent cohorts values show increase/decrease from Year 1 Cohort

 A few of my observations and curious on yours/other questions you have!

  • This is a snapshot from last year renewals. I added the Original Contract Date for clarity: 1 Year customers purchased in 2021 and renewed in 2022.
     
  • We removed all multi year deals from each cohort - if you bought in 2020, we dont count the automated renewal in 2021 as part of the GRR calc (aka we’re only looking at “Available to Renew”)
     
  • Highest GRR cohort are longest tenured customers. This makes sense to me.  If you’ve been a customer for 5 years or more, the likelihood that you remain a customer is high.  
     
  • I’m not sure yet how to interpret the declines in across 1 Year through 4 Years
     
  • One hypothesis is that our market/customers span all types of software/subscription companies including earlier stages 
    • Earlier stage companies have higher failure rates creating a ceiling for companies serving this market
       
    • We do have most late stage / large cap SaaS companies as customers - and many were early adopters of Gainsight, continue to use us and have much. much lower risk of failure


Userlevel 5
Badge +1

Thanks @tyler_mcnally. The decline over the first 4 years is curious indeed; I would have expected a gradual increase as you indicated in your earlier message. Especially, I would have expected the year 1 GRR to be lower than the following, as customers could just be trialing that first year. If at the same time, you've been improving the onboarding though (don't know exactly when Gainsight Essentials started), maybe that would have an influence?

Userlevel 5
Badge +3

We dug in more and the graph turns into a “smile” shape, with inflection at year 4 or year 5 and increasing GRR each subsequent year. 


I do think there are many complicating factors that impact the analysis which we may dig into in the future...

  •  This analysis does not include multi year deals. So all customers who signed 2 year deals would only show up in year 3 GRR.
  • Market environment - 2020-2022 very different from previous years, 2023 very different from 2020-2022 -- so what is the “normal” to compare to?
  • Improvements to onboarding as you noted

Reply