andorfuhrer
Helper ⭐️
May 13, 2020
Open

Show Totals in a Pivot Report?

Related products:CS Reports
  • May 13, 2020
  • 12 replies
  • 337 views

Hi GS Fam!

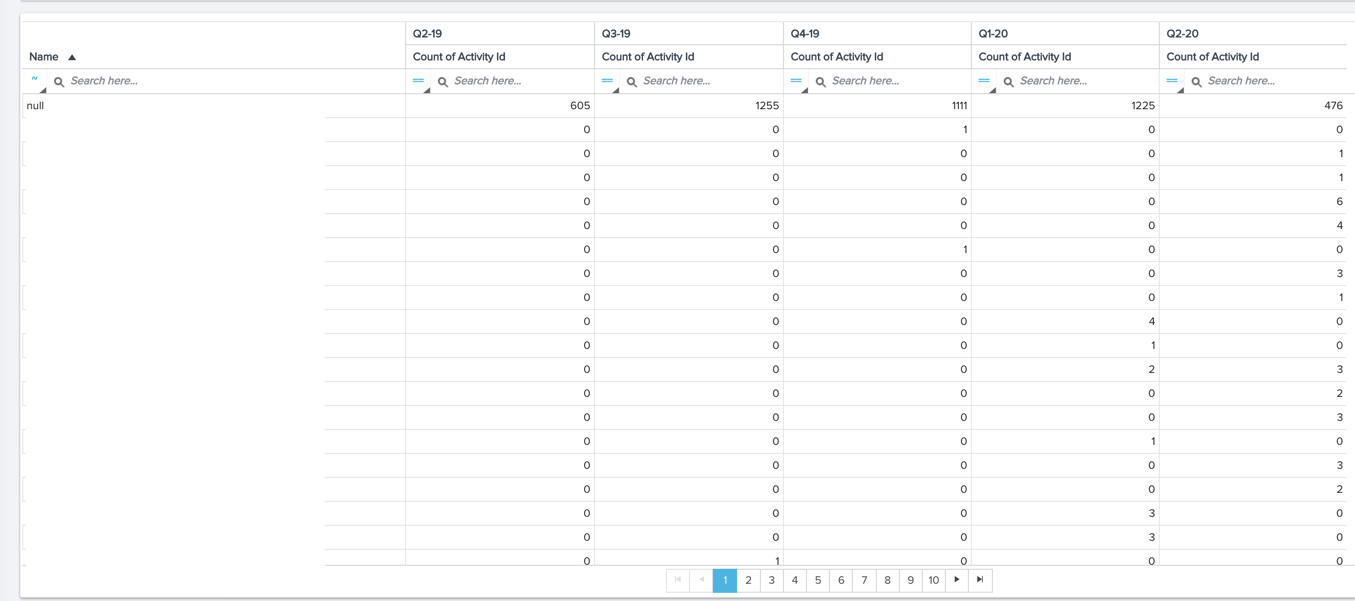
I created a pivot report by CQ.  Is there a way I can populate the total for all 4 CQ?   In the example below, I would love the total to either be the first or last column

Also, I am doing this via GS SFDC, not NXT
 

12 replies

rakesh
Gainsight Employee ⭐️
Lets put your data to work!
June 23, 2020

Hi @andorfuhrer 

Thanks for posting this. We will evaluate the technical possibility for this before we pick this up. 

werickson
Helper ⭐️⭐️
July 9, 2020

Was just going to post the same question!  Thanks GS Community

jean.nairon
Expert ⭐️
July 9, 2020

You could put it in a dashboard and include a second report with just the totals. Are you planning to share this report in a dashboard?

Jean
werickson
Helper ⭐️⭐️
July 9, 2020

Thanks Jean!  I did try that.  It looks a bit ugly because the the size limitation enforcement on the dashboard.

I ended up using a stacked bar chart that allows me to put the data point values in, which is probably a better visual anyways.

jean.nairon
Expert ⭐️
July 10, 2020

Perfect. That’s a good ida on the stack bar chart. It will definitely make things look better. 

Jean
narayanan_s
Contributor ⭐️⭐️⭐️⭐️⭐️
November 18, 2021

Can we get this feature at report level instead workaround using dashboard. There is a use case where in weekly trend, there is a ask to send leadership on the count and total spread across customers success plans, activities and CTAs etc. NXT horizon analytics does miss this show total flexibility, may be i couldn’t find, hope we could add if unavailable. @rakesh 

Narayan
Contributor ⭐️
January 13, 2022

I’d love if this could operate just like narayan said. Typically pivot tables have a column row and a sum column on it and it is pretty crazy to me that there is no option to do that!

Contributor ⭐️⭐️
July 7, 2023

@rakesh Can this be switched to an Idea for folks to upvote? I couldn’t find an existing Idea and this would be very helpful. If there is one, apologies as my searching only brought up this discussion.


We use lots of Pivot tables for assignments of our technical resources and to track Success Plan statuses. A column and row total would make things more succinct and easy to read vs. requiring someone to export the data or add yet another report to our dashboards. We have 1 dashboard with 7 pivot tables - this is not feasible to add 7 additional reports OR to export the data to get what we need. 

bradley
Expert ⭐️
July 31, 2023

@anirbandutta can this get converted?

anirbandutta
Expert ⭐️
August 1, 2023
No Status→Acknowledged
It's an opportunity for engagement