Hi everyone!

I’d love to hear what metrics you use in weekly reports to show customer engagement in your communities. 

Previously we reported on the amount of comments in a given week/month against our goals but we weren’t finding a ton of value with that metric.

What are you using and do you use the SF integration to track MAC (monthly active customers).

Thanks in advance for any help!


Hi!

We currently track

  • Peer-to-peer answer rate
  • Average response time
  • Sessions
  • Amounts of comments, questions and topics
  • Engagement rate

We’ve counted the engagement rate simply Amount of posts divided by sessions 😊


Adding to Suvi’s list:

  • Comments per topic → the more comments per topic, the more active the interaction on the community
  • Superuser answer rate → how many solutions are provided only by our superusers

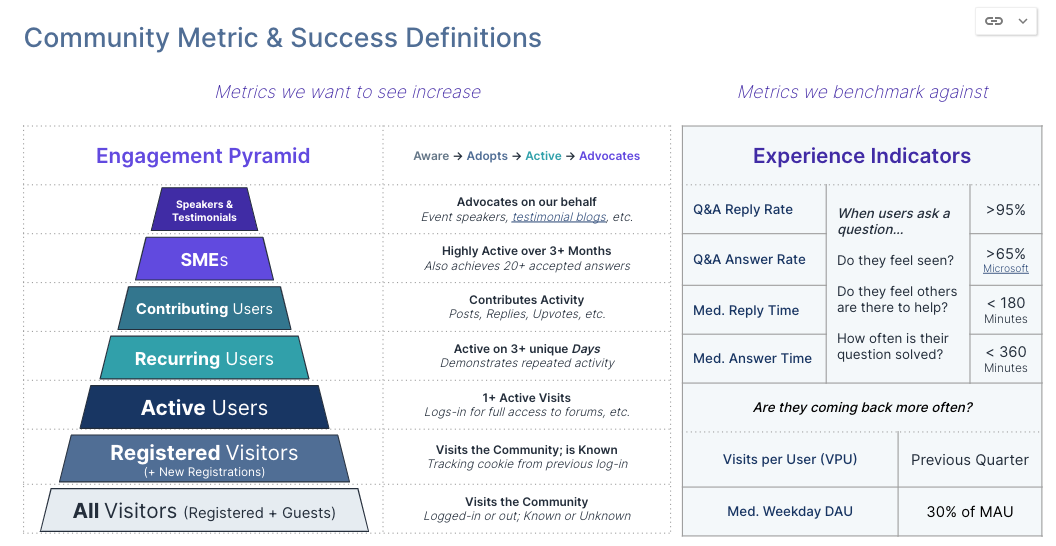
Here are the metrics I report on monthly and monitor daily/weekly: 


Our core use case is a support community, so Q&A is the predominant activity. On top of this, we look at external (non-staff) answer rate as both a measurement of external engagement, but also ROI of community helping us scale through non-staff contributions. 

SMEs = our superuser program. Requires 3+ months of 200+ points, plus 20+ accepted answers. 

The Salesforce integration is key here, as it gives us Visit events for measuring MAU and (my preferred metric) Monthly Recurring Users. MRU cuts out some of the noise of MAU and shows me users who are active on 3+ days within a month, a stronger indicator that they are engaged int eh community; whereas MAU fluctuates based on volume of net new sign ups and other noise. 


Hi @Taylor Lecky 

Here is an article from our very own @Julian . The two metrics I would point you towards are Aliveness and Responsiveness. They will help you judge the effectiveness of your categorisation and where you can streamline topic creation .


But also what @DannyPancratz has shown is a gold mine and will get you on the right track. ?


Reply