If you are ever stuck on getting some data or doing a use case analysis on PX, you might often hear your CSM coming with an answer “You can do it using Query Builder!”.
How can Query Builder help you?
If you need in-depth answers about usage, compare usage across different values, or something that is not readily available in UI and it is also very easy to use.
Let's break the query builder piece by piece
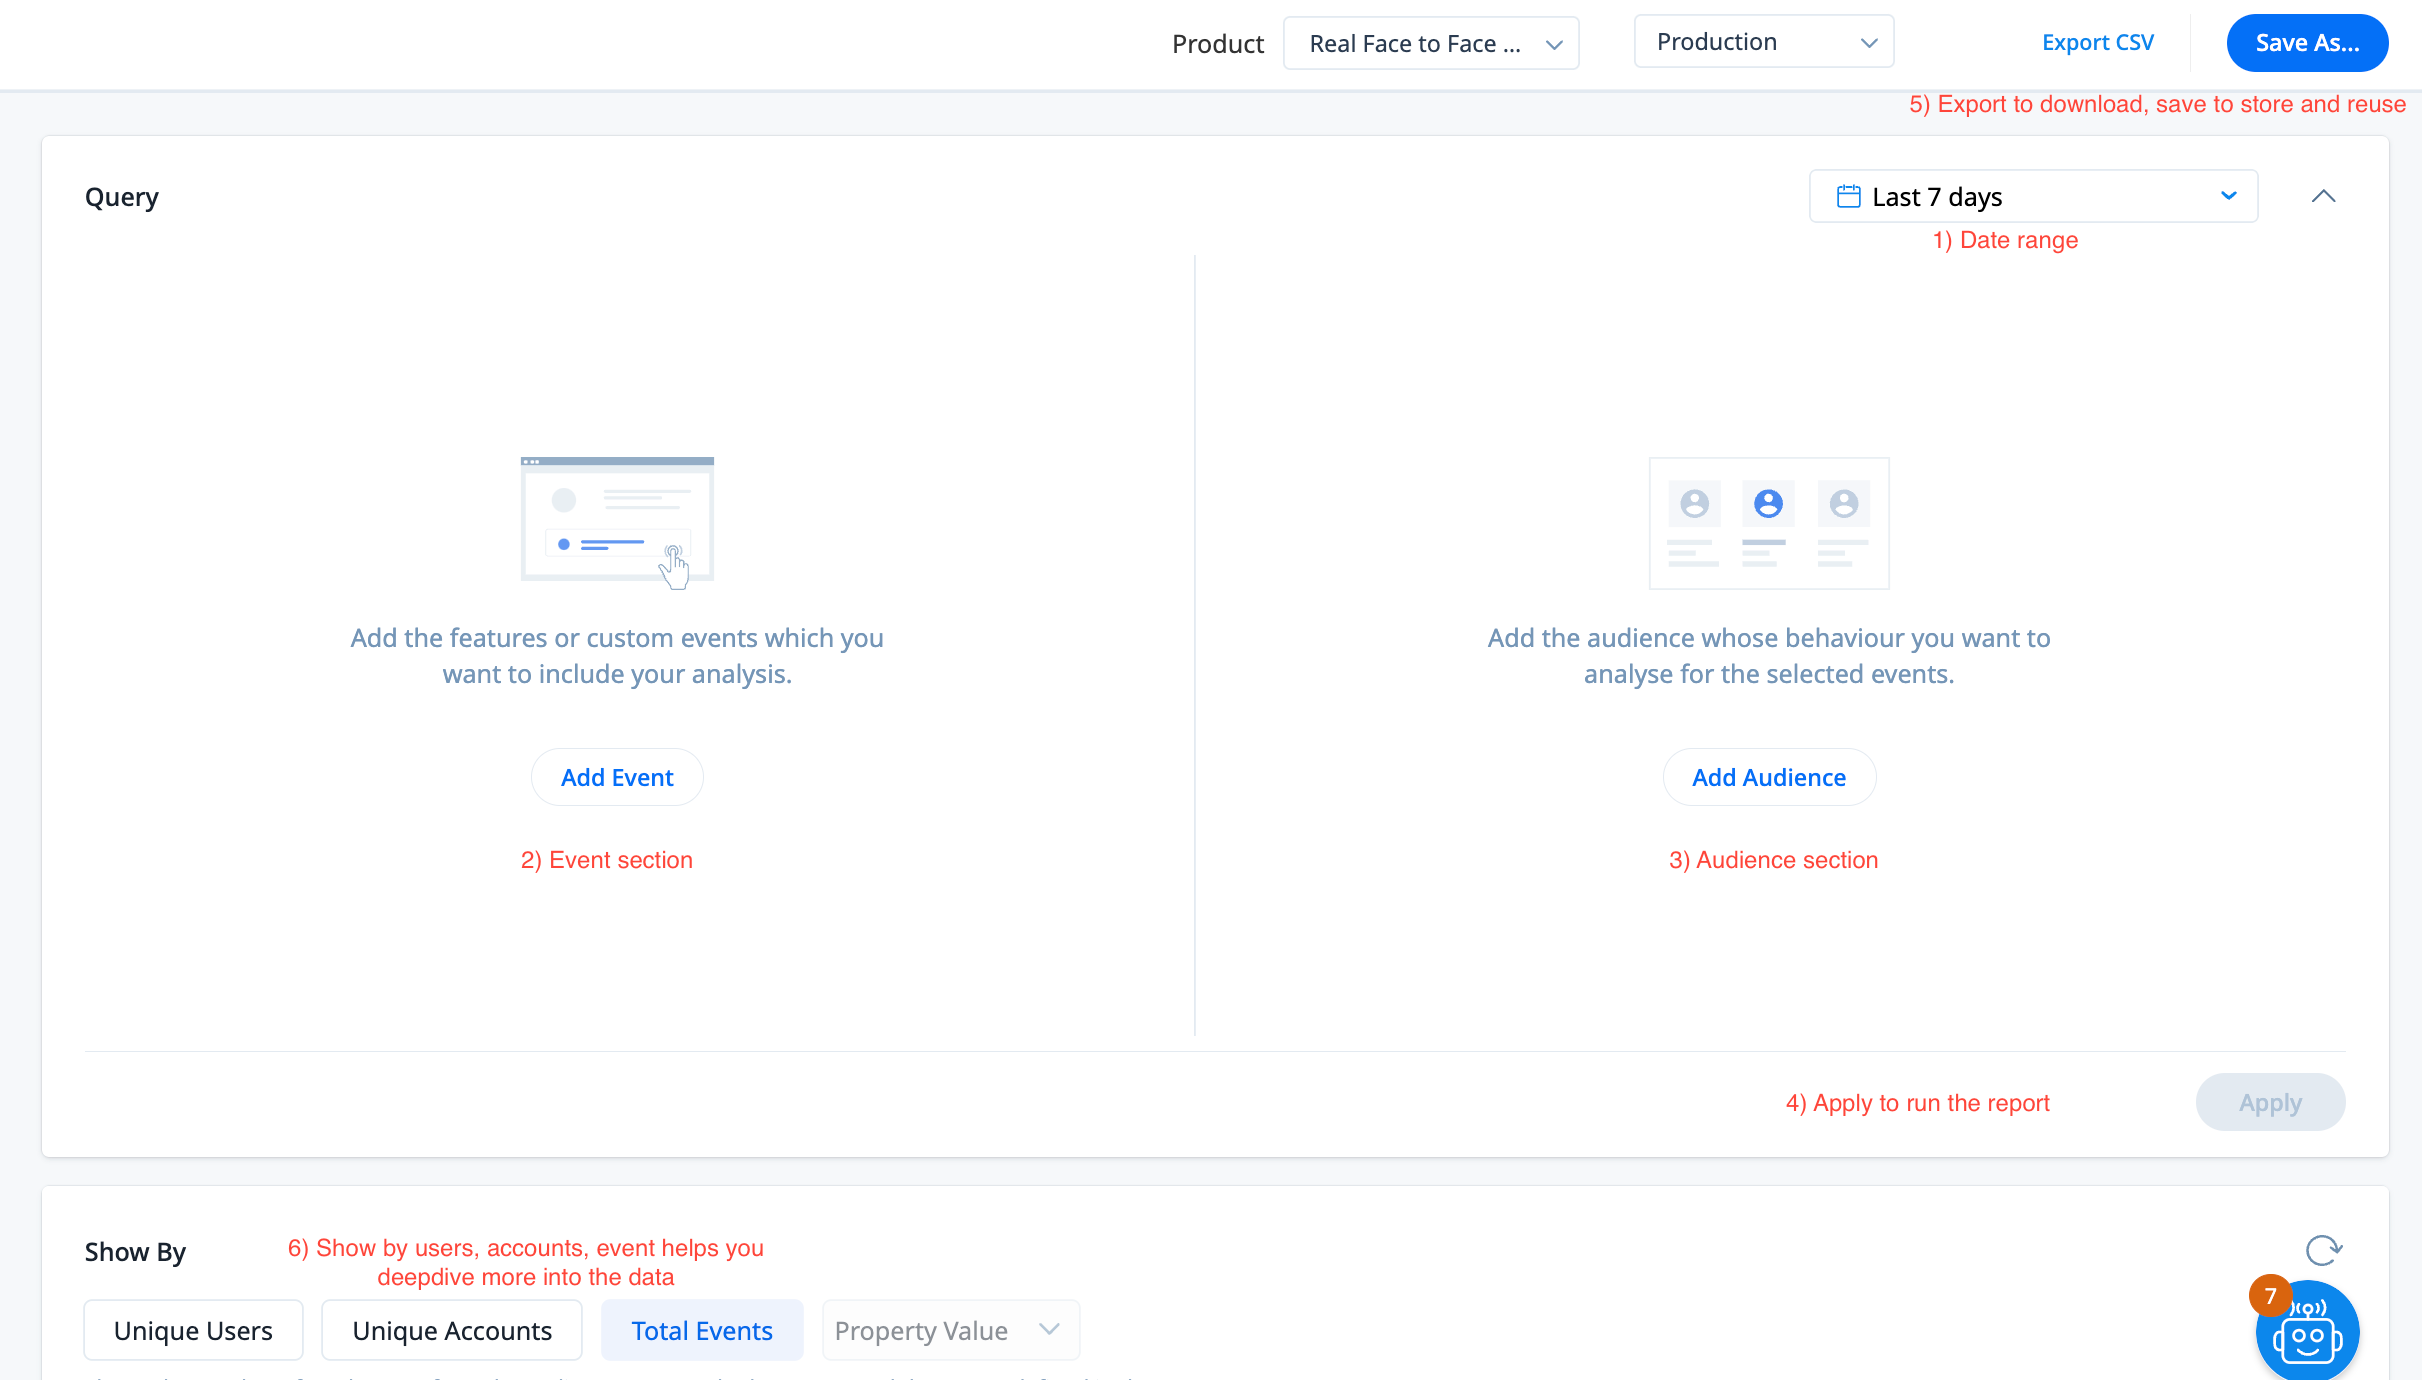
So the moment you click on query builder in analytics, it opens a page live below with the default 7 days of the data set. Add an event button and add audience section button.
Query Builder
We can break down the query builder in 6 sections like in the image above, and discuss them in depth.
Date range - Set the date range you want the data to reflect for the data you want to look at. You can set daily, weekly, and monthly. By default you would see 7 days.
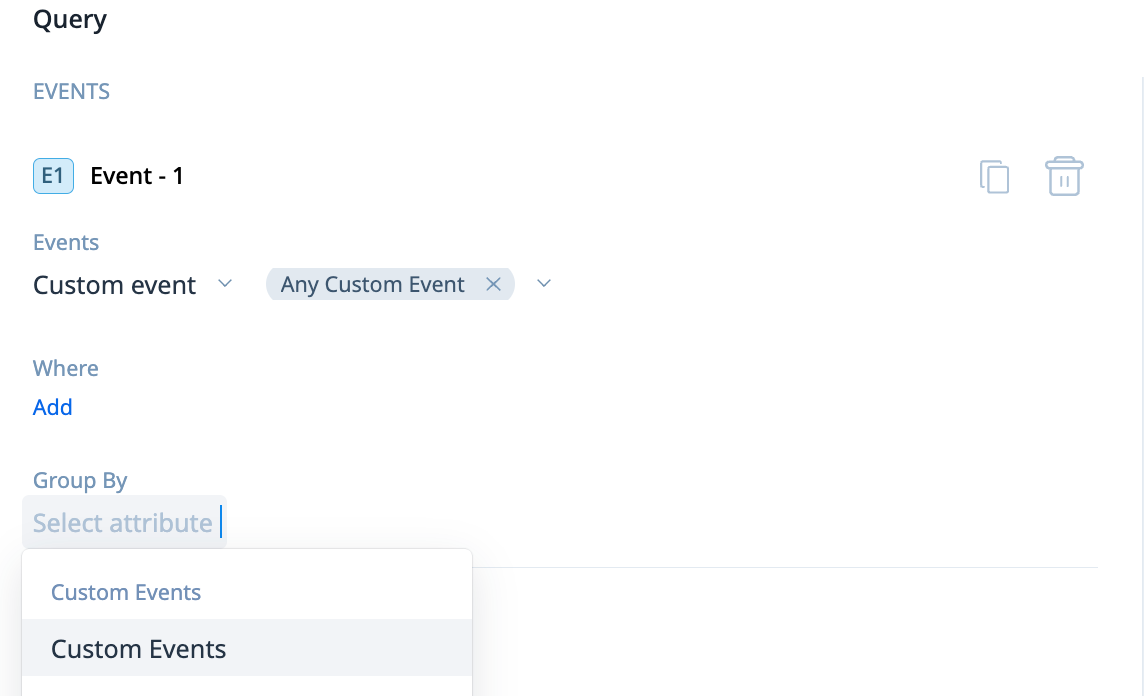
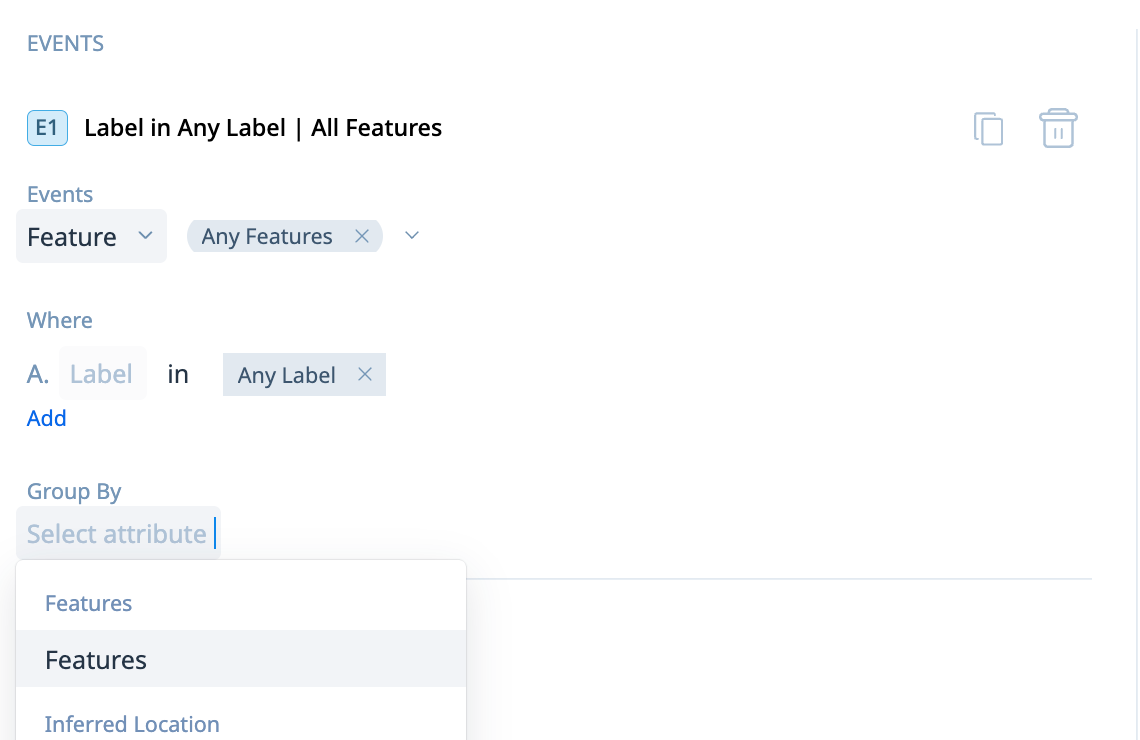
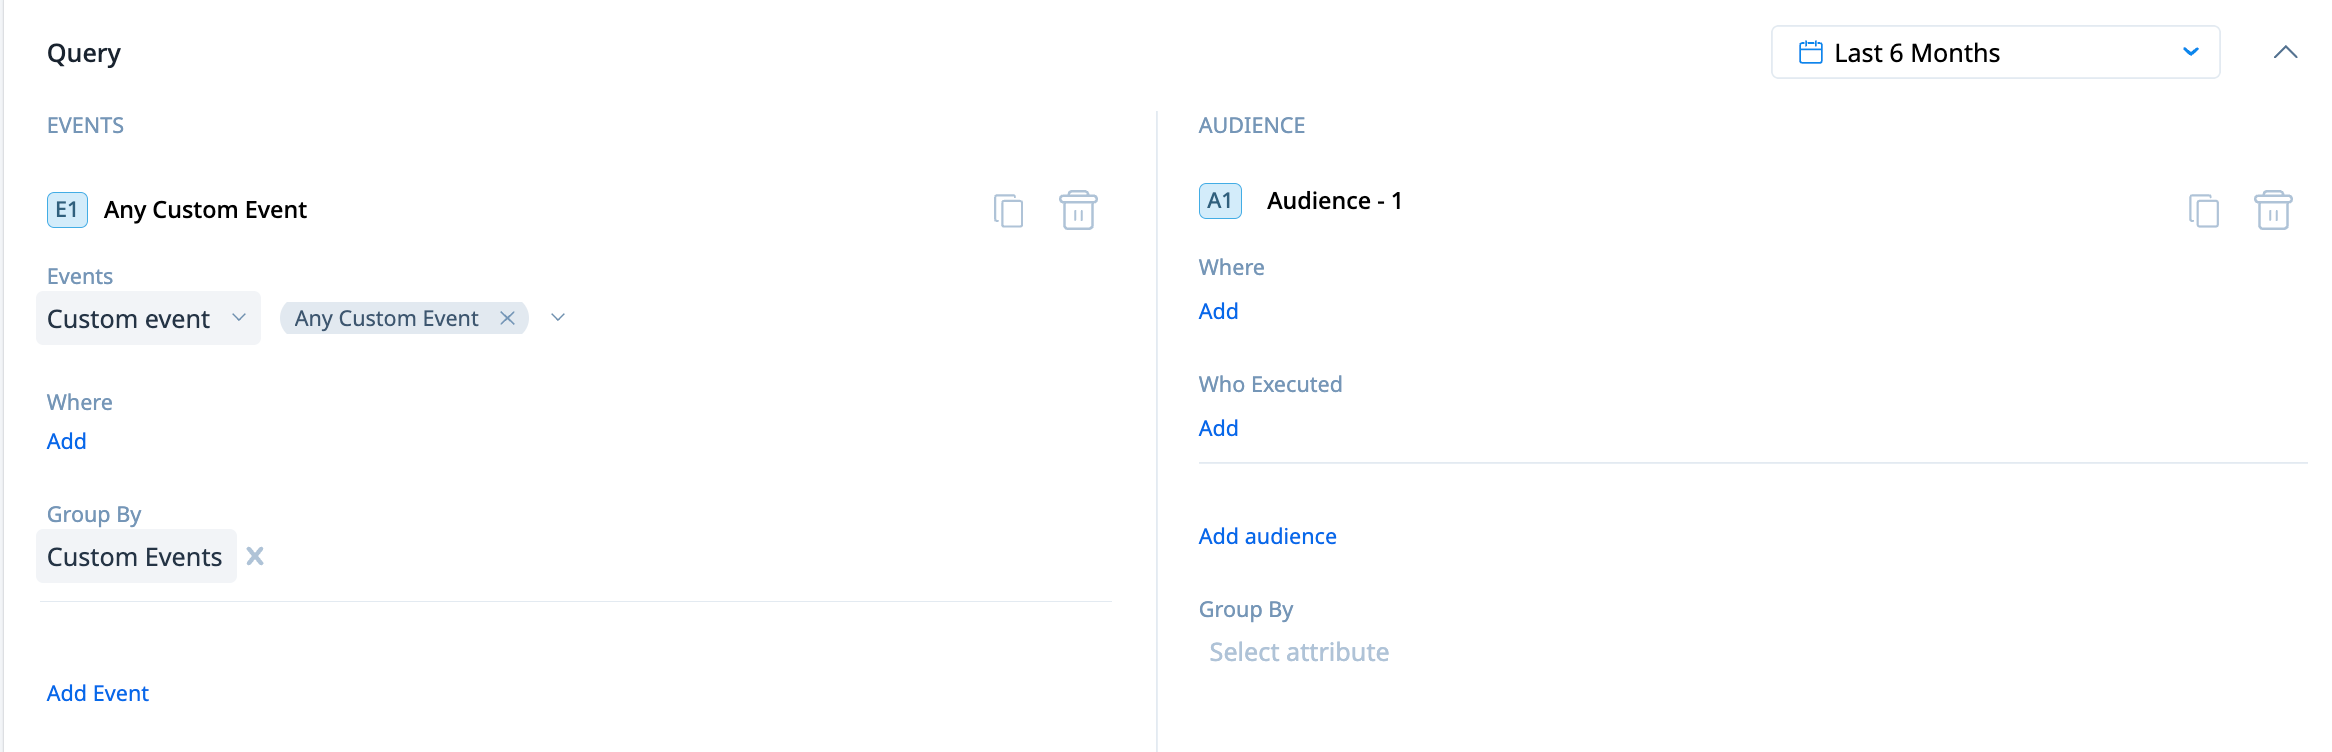
Add event section is where you will utilize being tracked or pushed into from PX from a utilization perspective such as custom events, features, engagements, session init, page views, and mobile screen events. a) Custom events - This helps you deep-dive into data from custom events that you are passing into PX.Custom event b) Feature - You can run reports on feature usage features mapped in the product mapper, and get more customized insights
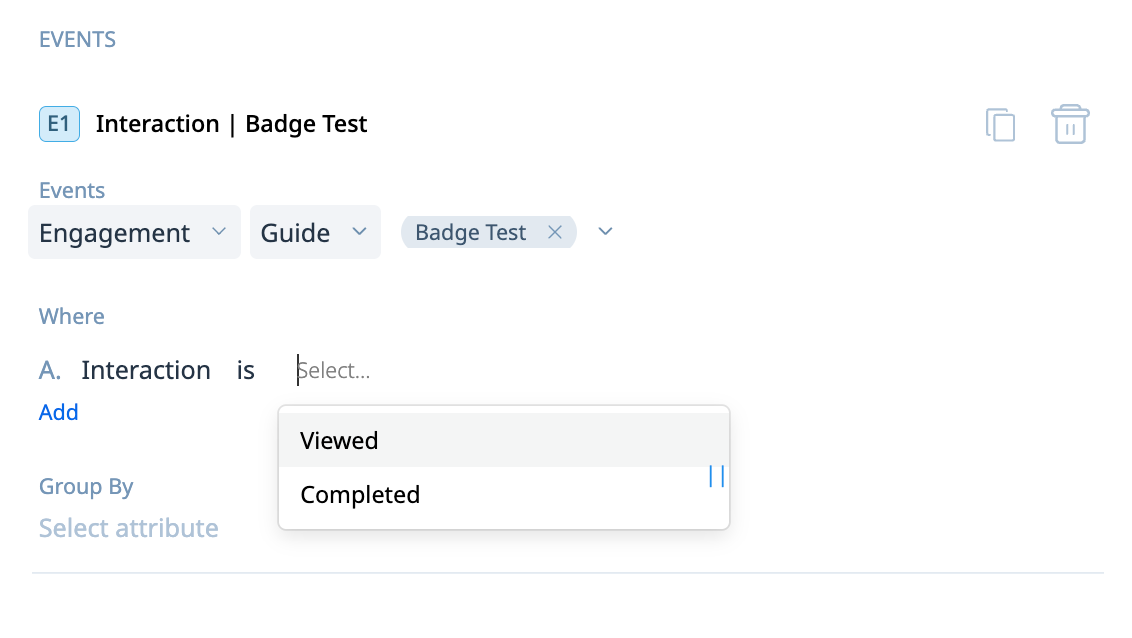
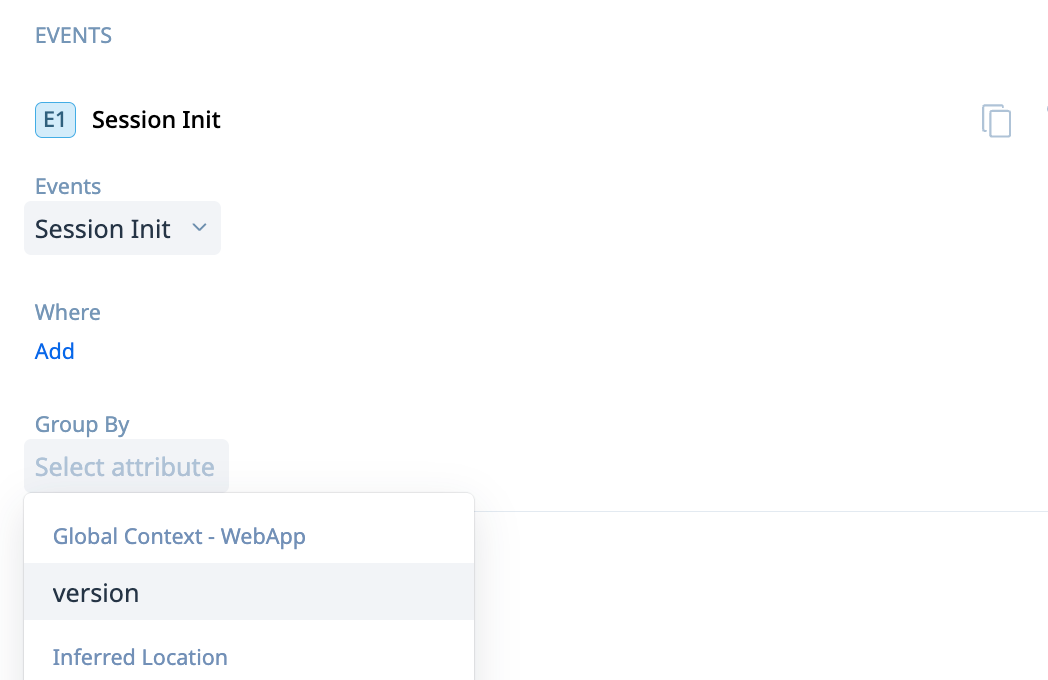
c) Engagements - You can run reports on the usage of engagements like guide performance, sliders, surveys, etc and this also helps you to compare engagements and how users are interacting with them. If the engagement has been just viewed or completed. Also if you are running a survey, you can compare if the promoters to detractors and passive etc. d) Session init - this can help you identify the number of users from a company who are actively using the platform and how active they are on a daily/weekly/monthly e) Page view - If you are missing some pages to be added to the PX product mapper, but if you want to view info based on page views this is the place f) Mobile screen events - If you are using mobile tags for your product, you can deep-dive more into which product and how many events happening on your product.
Audience section helps you segregate the users based on the user or account attribute information that you are passing into PX. You also have the option to deep-dive into the information by using who executed a feature at certain times and also a number of times.
Apply button helps you run the query and get insights for the information or comparison you were looking for.
Export helps you to get the desired data into a CSV, and save helps you to utilize the report in the dashboards you want.
Unique user - helps you get an overview of the total unique users for each cohort, unique accounts help you get the info of the accounts in that cohort, and total events give you a rundown of the number of times this event has been done in the selected time period.
Awesome, as we finished discussing what all options query builder has, let’s discuss how and where to leverage them.
Every section has an option of group by, which helps you to see info based on location, account name or even email id. This will do the grouping as suggested in the name.
Use cases :
Let’s go with the options we have in the events section.
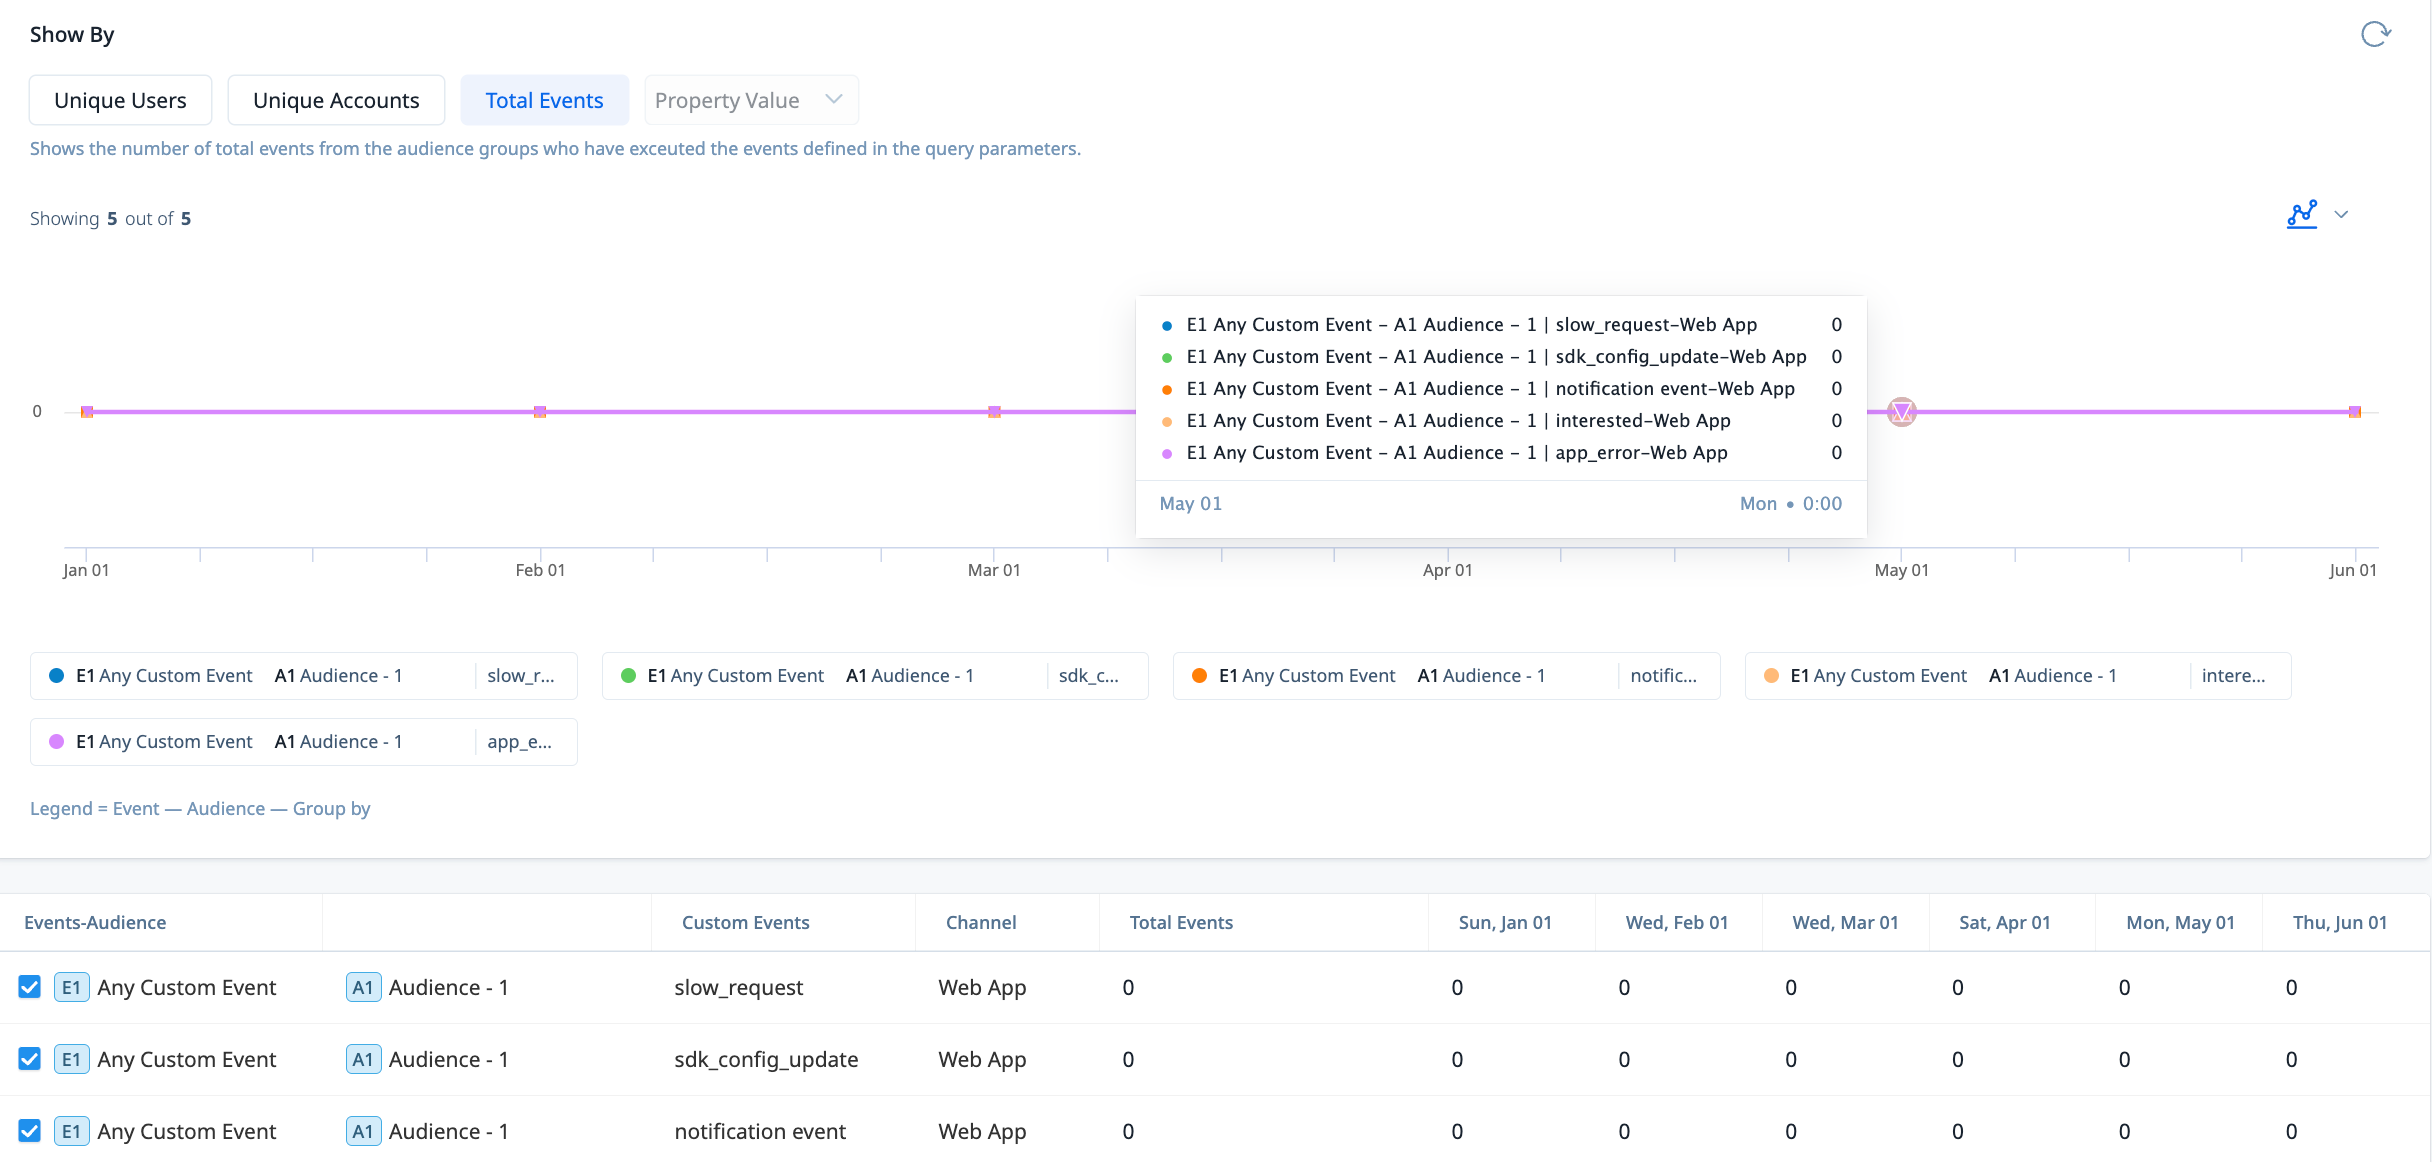
Custom events - If you are passing custom events for number of times user has finished a certain activity, then you can see number of times that all users are doing this and even if you group by account name you can also see the activity per account level. You can also pass error messages when occurred into PX using custom events, and see how many times this is happening for a customer so we can address the issue before the sentiment goes bad.
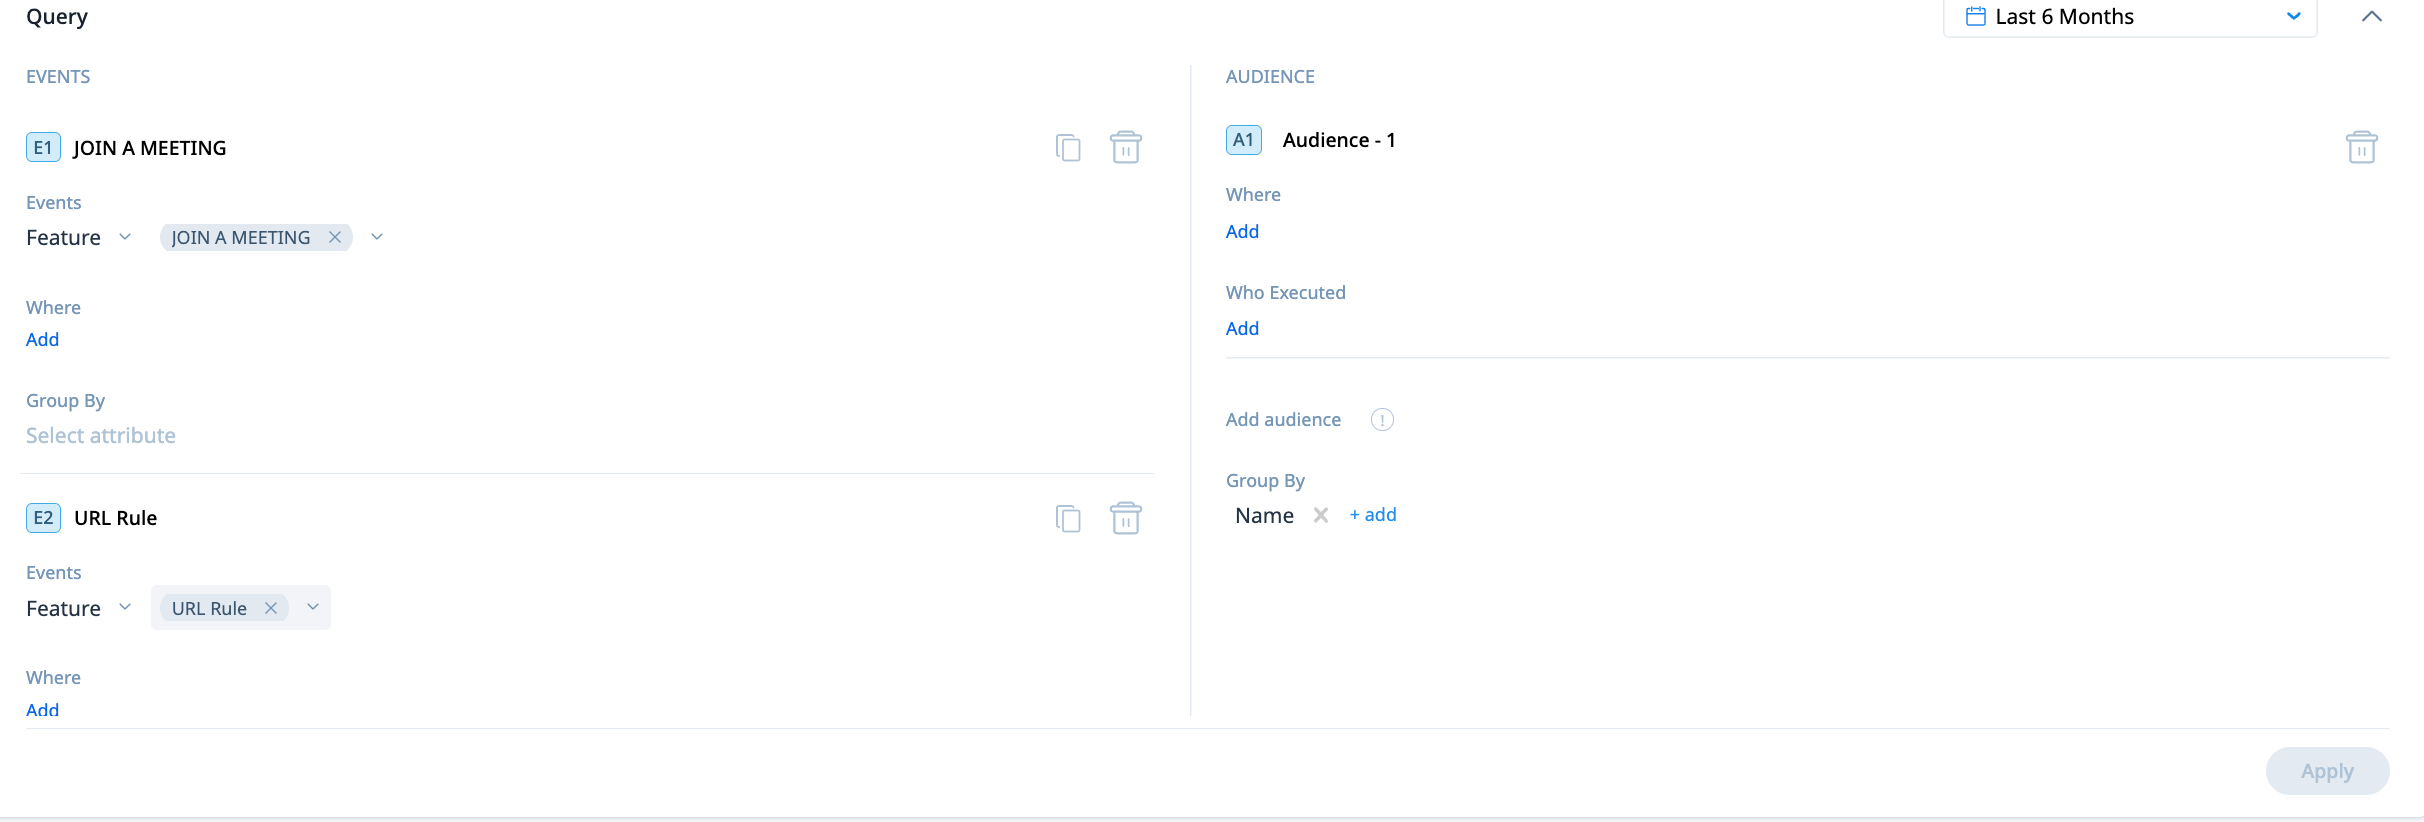
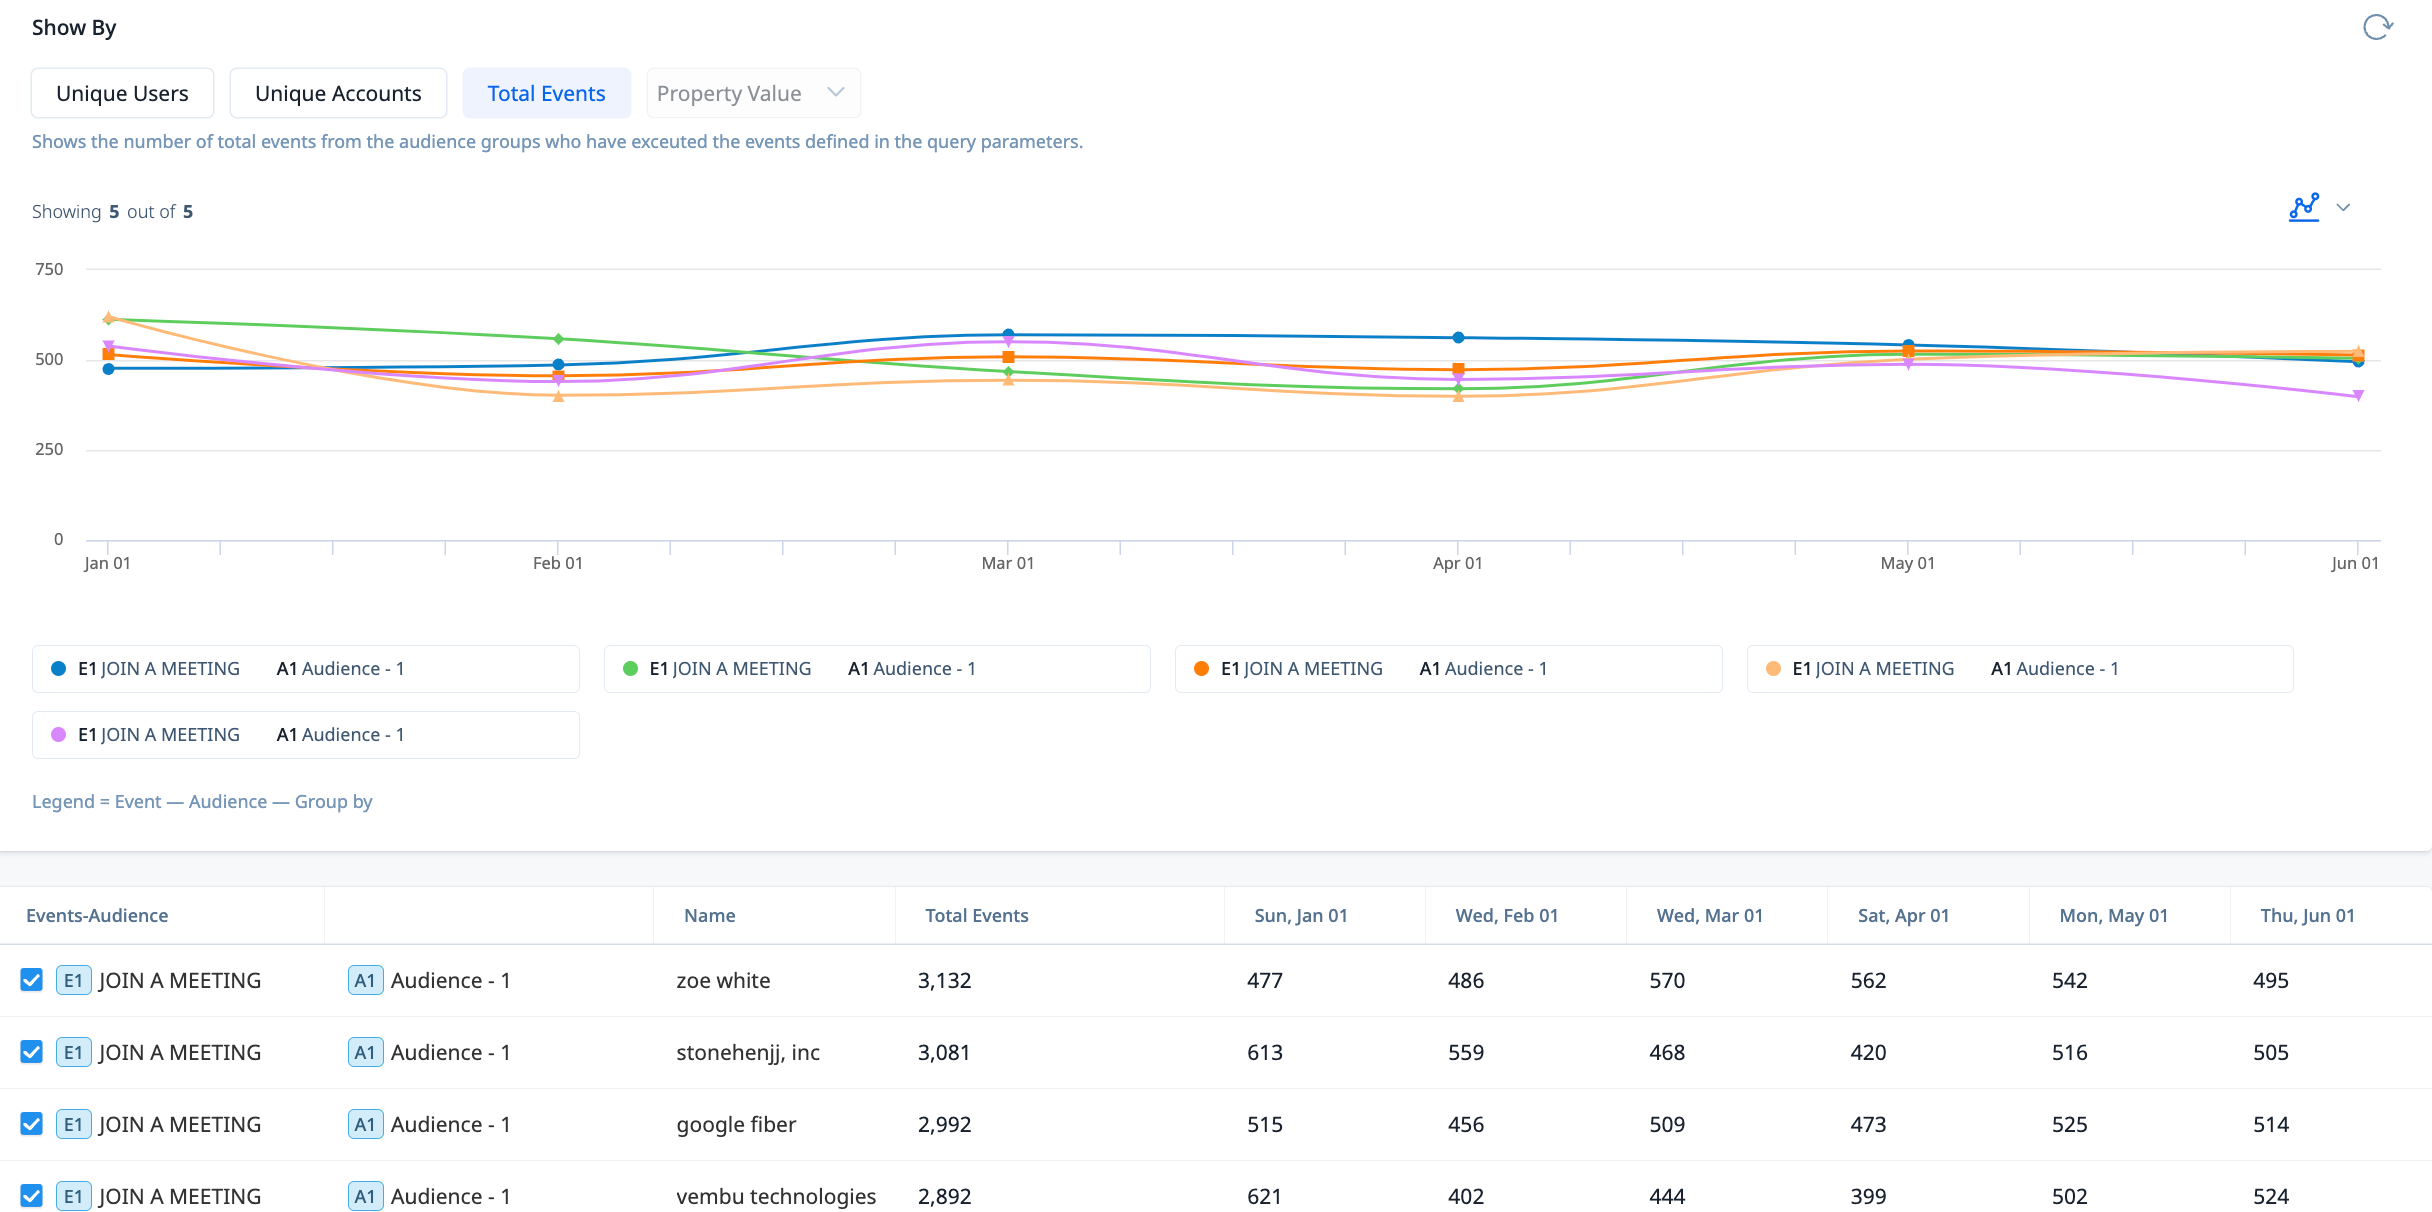
Feature - Leveraging the features added into product mapper, you can now compare the utilization of your “aha” moments. You can see how customers are utilization trends over the period of time let’s say month on month. Even by grouping it by accounts, you can see increase or decrease in utilization of specific account. In the below example, I did a comparison between Join a meeting feature and URL rule and grouped them by account name, and you can see the results below.
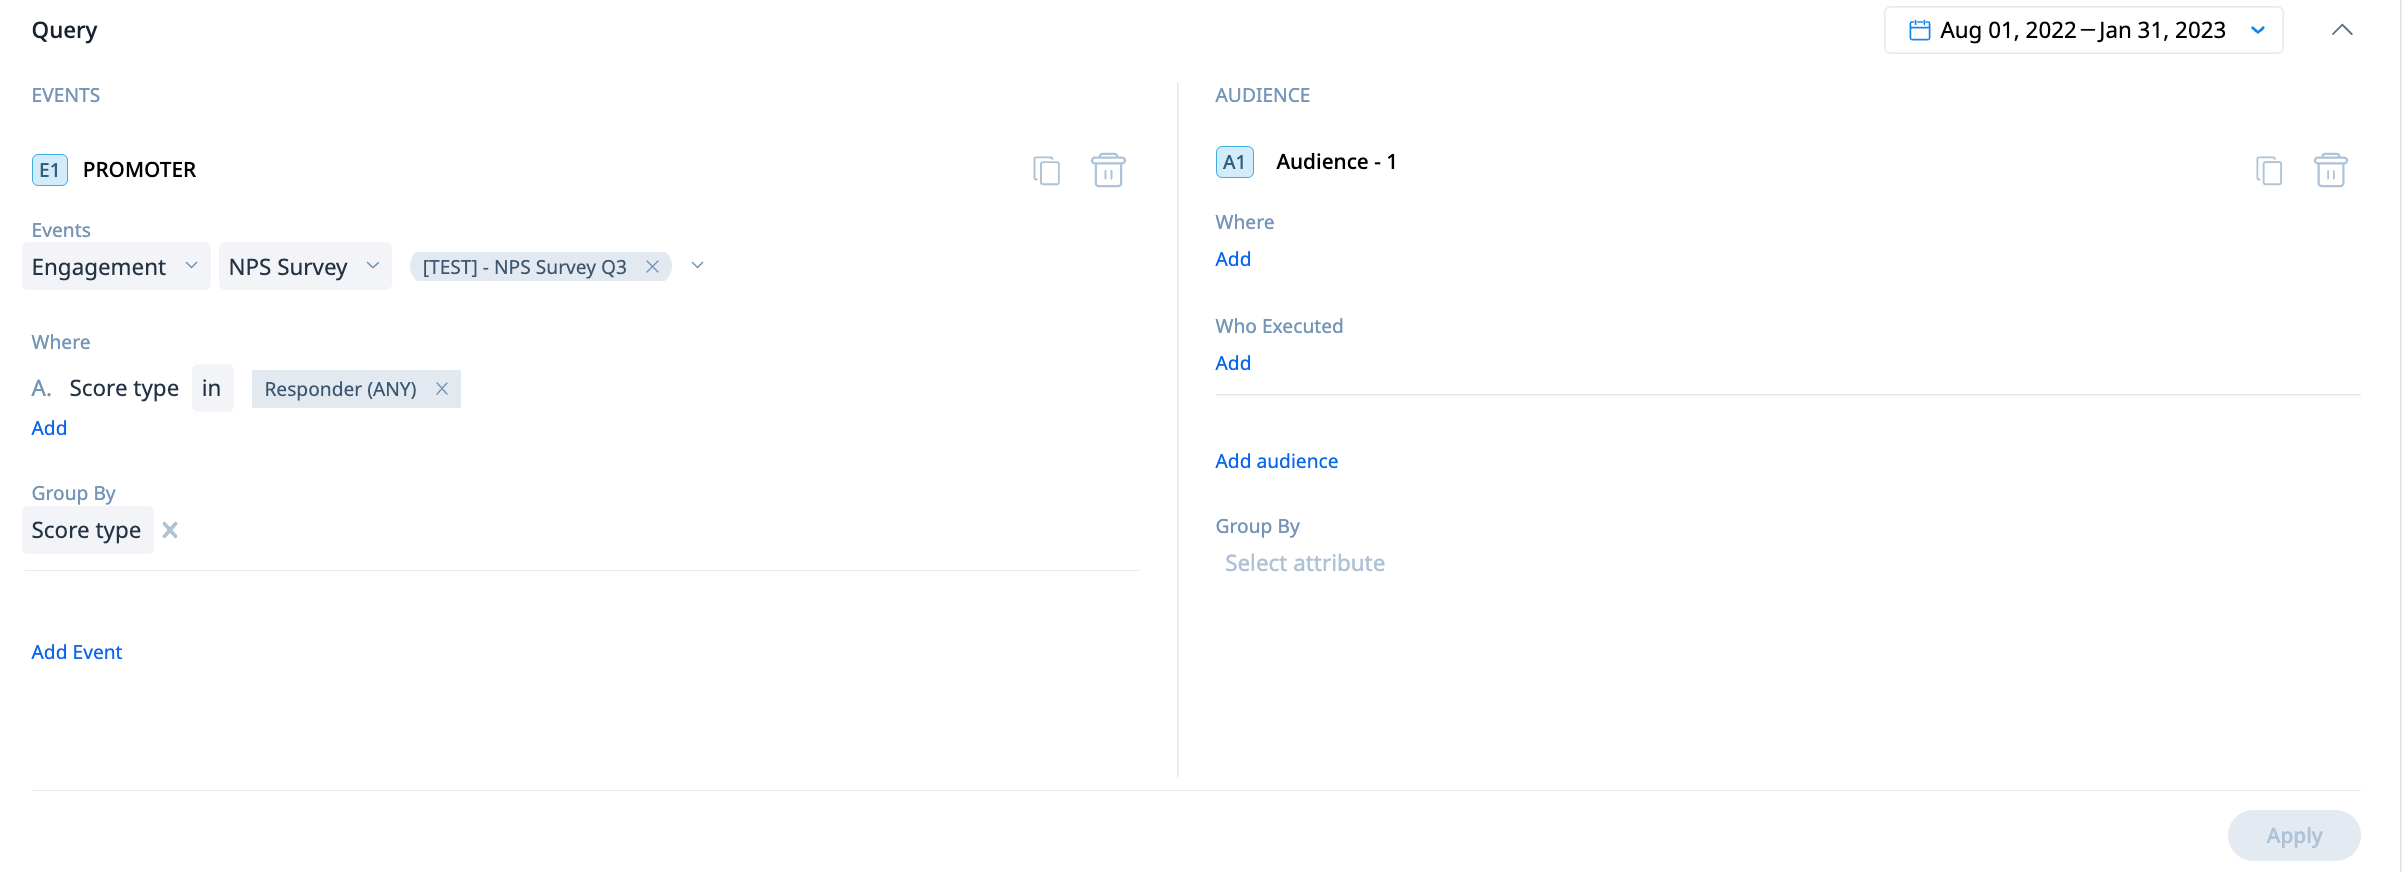
Engagements - Comparing NPS responses, guides and sliders to understand user maturity and make sure you are giving the right content to your customers and also get to know what is working and what is not. In the example below, I have select an engagement and grouped by response type so you an compare by number of responses received by each segment type.
Session init plays a major role on identifying number of licenses being used by each customer and number of active users are there for each customer. You can select session init and date by monthly, and group by account name and unique users to identify licenses that are active.
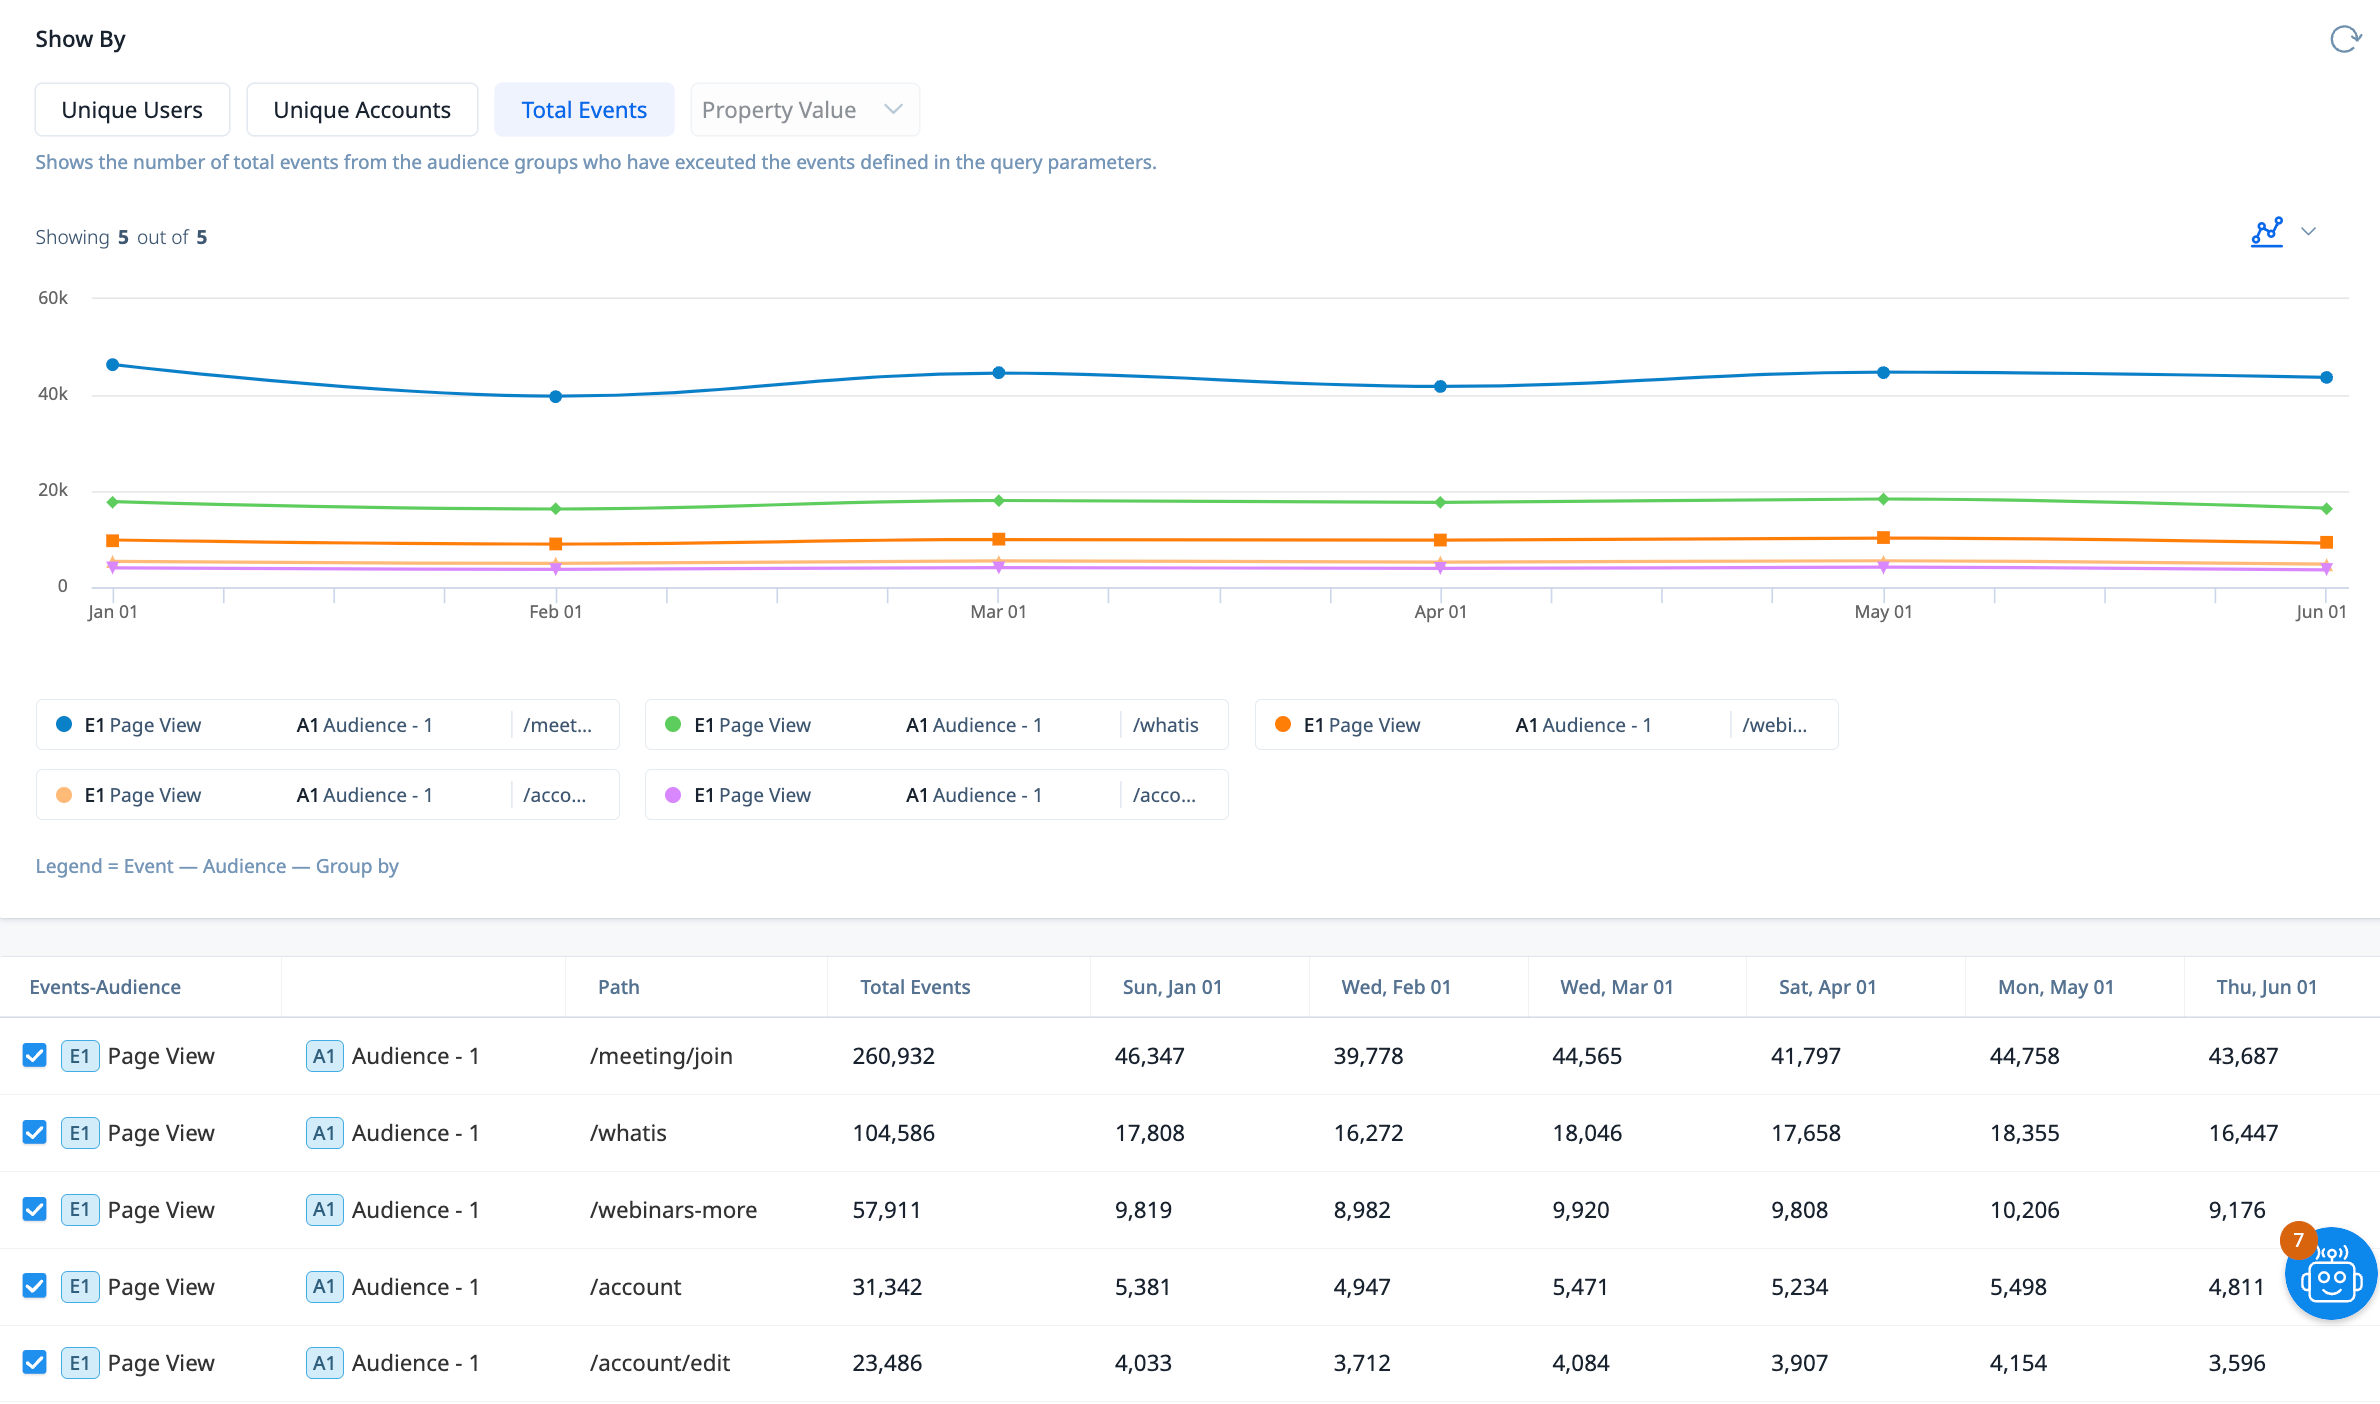
Page views have a great use case. You can bring the page views data directly by using page title, or page path. If you are running marketing activities you can check by query parameters. Having dynamic subdomains for customer, you can also utilize host filter aswell. You can just group by any of the above shared options to let PX run the reports and share them with you. For this example, I did group by path so I can understand what users are using the most, and I guess I have my result.
Mobile Screen events can let you know on how many users are using what type of mobile os, and you can deep-dive more into version and type of device and more things that are helpful for your designer and developers.
Hope this will be helpful. Comment some of your use cases that you used query builder for!
If you ever had a profile with us, there's no need to create another one. Don't worry if your email address has since changed, or you can't remember your login, just let us know at community@gainsight.com and we'll help you get started from where you left.
Else, please continue with the registration below.