Question 1: On average, how long do users who have previously engaged in ____ feature spend in our product per session?
- Custom Dashboard widget: Average Session Duration
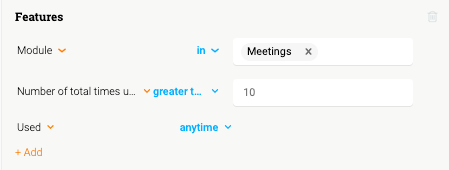
- Filter: [list]
- Features > Module in ______
- Number of total times used greater than ____ (I weighted this number differently per module based on other data we have in GPX)
- Used anytime (you could probably also change this to match the time parameter of the widget if you wanted to be that specific)
I repeated the above process for 3 different modules so I could compare them. In the screenshot below, from left to right the widgets filter to modules that represent increasing levels of adoption/stickiness to us.
We were able to conclude that the stickier the module, the more time on average the users spent in our product. On a sidenote, it's not necessarily our goal to have users spend longer and longer in our product. We want to make sure that they are getting value delivered - and sometimes the value could be that they are needing to spend less time in our product, not more!
Question 2: For new users in the last week, how long do they spend in our product during their first interactions and how often do they engage?
- Custom Dashboard widgets: [list]
- New Users - Daily in the last 7 days
- Average Session Duration [list]
- Filter: User > Signed up less than 7 days
- Filter: User > Signed up less than 7 days
Though this isn't as 1:1 as cohorting new users, we are still able to conclude that new users' sessions are less than half the length of average sessions (~16 minutes) and that new users engage in ~2 sessions in their first week. What would be really interesting and valuable is to compare these numbers with A/B testing where group A gets onboarding engagements and group B does not.
That's all for now, thanks for pushing out the awesome new release!


