Question
Changing axes in reports

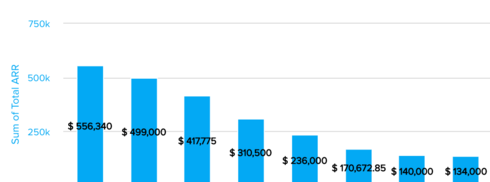
Is there anyway to change the scale of the axes or are they preset. The values on my graph are closer to each other than they appear because of the pre-set axis values.

Sign up
If you ever had a profile with us, there's no need to create another one.
Don't worry if your email address has since changed, or you can't remember your login, just let us know at community@gainsight.com and we'll help you get started from where you left.
Else, please continue with the registration below.
Welcome to the Gainsight Community
Enter your E-mail address. We'll send you an e-mail with instructions to reset your password.