Group by using numeric and calculated fields in reports
Page 1 / 1
Hi Jahnavi, For the second part of the question are you referring to Formula fields in Reporting, here is the similar ask.
For the First part of the question, could you please share us the use-case,where you need a numeric field in Groupby.
Since its a new enhancement request, changing this to an idea post.
For the First part of the question, could you please share us the use-case,where you need a numeric field in Groupby.
Since its a new enhancement request, changing this to an idea post.
I was looking at a use case to count number of customers that fall in the range of 100-200 for metric x
Right, this would be similar to "bucketed fields" in standard SFDC reporting. You can define a range of values to bucket accounts into and then compare that against a different value on the y axis. SF DC reporting is gross (non lightening/wave), so it would be nice if this was doable in Gainsight.
Hi Jahnavi,
If I understand your use case correctly, you want to show the number of customers for which the value of a given metric is 100-200, right?
You can do this by setting the account name field in the report as an aggregation (count distinct) and in your filters, apply these two with an and condition linking them: "metric > 99" and "metric < 201".
This should give you a number of customers where that condition is met.
Thanks Dan, I guess this would work for a widget but not a bar chart right?
You could show this data using a bar chart visualization if you add a field to the "By" section to give you more than one numerical value to report on.
So, for example you could apply the same logic: setting the account name field in the report as an aggregation (count distinct) and in your filters, apply these two with an and condition linking them: "metric > 99" and "metric < 201". And add a field like "Region" to the "By" area, for example.
I have a calculated field say ABC which is nothing but some percentage. I would like to count number of customers and group by ABC. This should automatically prepare ranges and count the number of customers in each range
Hi Dan,
Seeing your explanation to Jahnavi, We need to find a workaround to use a formula or a field number in reports?
I have different use cases that I tried to use a formula field, for example, A Region field that is defined in a Case Formula based on states and any others.
My question is, this is a bug that Gainsight are looking for to solve or it's working as expected?
Thanks
Hi Olavo,
Can you post some more detail around your specific use case and issue? I'm not able to determine the exact scenario you're facing.
Thanks,
Dan
Can you post some more detail around your specific use case and issue? I'm not able to determine the exact scenario you're facing.
Thanks,
Dan
Hi Dan,
I think my case is exactly the Post name.
When I try to use a numeric field or a formula field and group then. The report doesn't allow it.
For example:
I have some implementation projects and a picklist field that registers each of them, but some have their duration of 4 weeks, 8 weeks and 12 weeks.
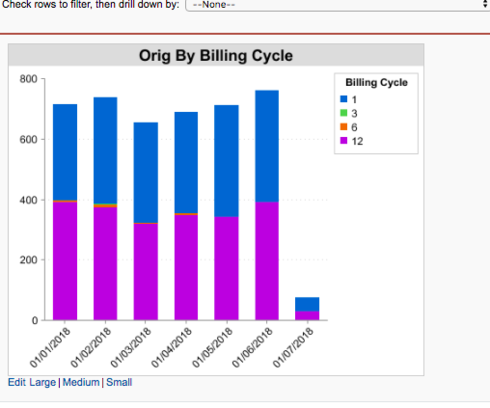
I made a formula field that group the projects by their duration and I would like to see a stacked bar chart with a trend selling of our implementation projects.
I'm still not following this exactly. Can you show an example (using Excel or another charting tool) of how you'd like the output to look?
Hi Dan,
I'll take another example but that's pretty much the same case:
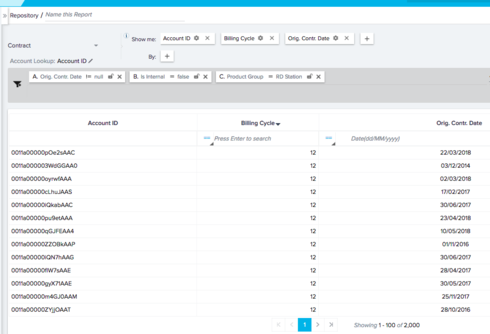
Here I would like to get all accounts and group by Billing Cycle which is a number field (but could be a formula field)
And with this, input a percentage of each type by new accounts per month.
My fields are:
Col A = Account
Col B = Billing Cycle
Col C = Contract date
So, from here I would like to query them like this:
QUERY (A: C; "Select C, B, Count (A) where C is not null Group by C, B"; 1)Out of the Gainsight is simple to do, the job is always getting information extracted.
An alternative is to create the report directly in Salesforce that would look something like this.
But in our organization, few CS are aware of Salesforce. Ideally, would be the Gainsight create these charts.
I understand what you need now, Olavo. Thanks for showing the detail.
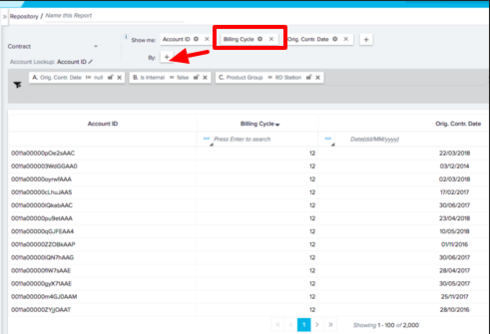
You can do this in Gainsight by moving the "Billing Cycle" field to the "By:" area of the report.
Dan This is exactly what I want! uhauAHua
but Billing Cycle is a number field and is not allowed to do it.
My point here from the beginning is if Gainsight is looking to enable to do it with Number and Formula Fields.
Thanks for your attention.
but Billing Cycle is a number field and is not allowed to do it.
My point here from the beginning is if Gainsight is looking to enable to do it with Number and Formula Fields.
Thanks for your attention.
Ah, sorry. My mistake. You are correct that field types of number are not currently supported in the group "by" area. I've sent a note to the product owner to get clarification and input on this.
Reply
Sign up
If you ever had a profile with us, there's no need to create another one.
Don't worry if your email address has since changed, or you can't remember your login, just let us know at community@gainsight.com and we'll help you get started from where you left.
Else, please continue with the registration below.
Welcome to the Gainsight Community
Enter your E-mail address. We'll send you an e-mail with instructions to reset your password.