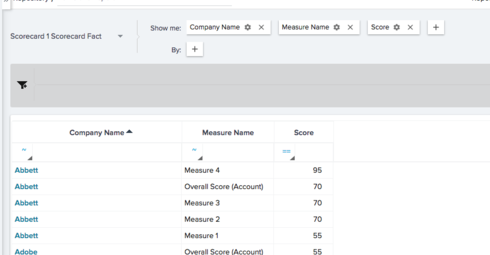
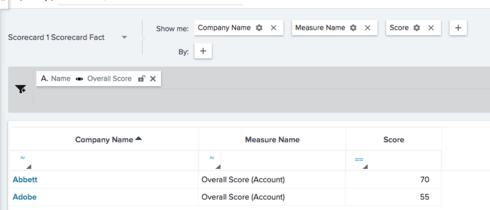
When reporting with the Scorecard Fact object (where the name of your scorecard precedes "Scorecard Fact"), I am getting a TON of duplicate submissions on a per account basis. I can take care of this in some reports by using "count distinct" of SFDC ID in the Show Me section.
However, I am trying to do a scatter plot with the Y-axis as "Avg Health Score" and the X-axis as "Customer Lifespan (Days)". I then group by SFDC ID. The issue is I get several submissions for each account and that throws off the whole scatter chart. I am not seeing a way to group by [i]DISTINCT SFDC ID.
Is there a good way to get this done?
Is there a better way to work with this data so I don't have to remove duplicates?
Question
How do you remove duplicates from scorecard fact reports?

Sign up
If you ever had a profile with us, there's no need to create another one.
Don't worry if your email address has since changed, or you can't remember your login, just let us know at community@gainsight.com and we'll help you get started from where you left.
Else, please continue with the registration below.
Welcome to the Gainsight Community
Enter your E-mail address. We'll send you an e-mail with instructions to reset your password.