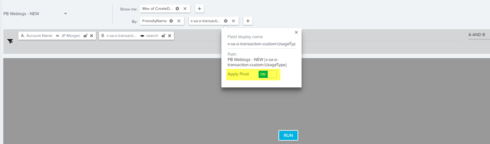
I am trying to create a pivot table on a report I have built in the Report Builder. The pivot is needed to display the data in a form that is actionable for our CSMs. Basically, just showing the clients usage behavior on each metric we measure and the date of the last time a user utilized that feature in our platform.
However, I noticed that when [i]I apply the pivot on either the User's name or the Usage Event, the date field converts from a Date to a String. So, if the original value was "3/26/17", after the pivot, this is marked as "2,017". So, it drops the day and month, and to me it looks like it's a string field due to the comma.
Just wanted to post this to see if this was expected behavior or if there was a workaround this issue? Thanks!
Question
Report Builder Pivot Table Option


Sign up
If you ever had a profile with us, there's no need to create another one.
Don't worry if your email address has since changed, or you can't remember your login, just let us know at community@gainsight.com and we'll help you get started from where you left.
Else, please continue with the registration below.
Welcome to the Gainsight Community
Enter your E-mail address. We'll send you an e-mail with instructions to reset your password.