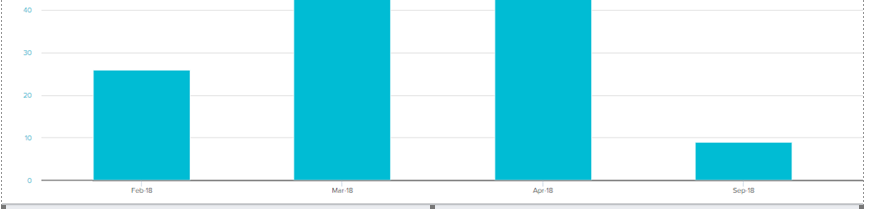
Does anybody have a solution for showing a total as "0" without disappearing completely? For example: the usage data we have below has usage for Feb, March, April, then jumps to September. We want to avoid adding a false "+1" for months without usage but want to be able to show a more clear picture of usage over a year.
Example of report below:
Best answer by skalle
Hi Manmeet,
This may not be the solution you are looking for, but this was a usecase we were solving for another customer and this is what we did.
We have introduced a new module called "Adoption Explorer" which is currently in limited release getting into GA this July . Adoption Explorer(AE) is our fit to purpose module to handle any Time series customer data like Usage data, Case data etc. You can ingest data into Adoption Explorer from variety of sources like S3,our own PX, Google analytics, GS MDA objects, SF etc.
AE allows you to calculate wide variety of metrics in a very scalable easy way and build Trend analytics which is specific for data like Usage. All metrics in AE are available for Reports and Rules etc.
Why I am saying above is that, in AE, we have a feature to address this. For e.f if you are bringing data via S3, you can enable option "Skip the source if file is not present" and what it does is like in your above example , if file is not present for May, it skips and computes all metrics to "0". Now if you build a report on top of this object, you would get to see the data the way you want.
If you want a demo of AE, please reach out to your CSM and we can arrange a call.
Hi @manmeet_dosanjh - what does the table of data show for that same data set? I'm guessing that there is simply no data for the months of May, June, July, and August. If you'd want to show a continuous time series, you'd need to have a value (even if it's zero) for each month in the series.
A report can be either a Time Series or Distribution/composition. In today's product only line visualizations are treated as time series where as a column visualization is not. Hence today, you do not see any column for 0 data. Can you check if line visualization solves your problem.
A workaround which I do not recommend is adding 1 to the measure(show me) leveraging formula fields so that 0's show up as 1.
Yup that is correct. Each record has values for the usage event code, ip address, username, and date.
I use the report builder to aggregate usage into 'Month' format. That makes sense, only way to display with current format of our data is to create 'fake' usage event for each month that the account didn't use it for, not ideal but had to see if anyone had a workaround. Thanks Dan!
If you ever had a profile with us, there's no need to create another one. Don't worry if your email address has since changed, or you can't remember your login, just let us know at community@gainsight.com and we'll help you get started from where you left.
Else, please continue with the registration below.