Hi guys,
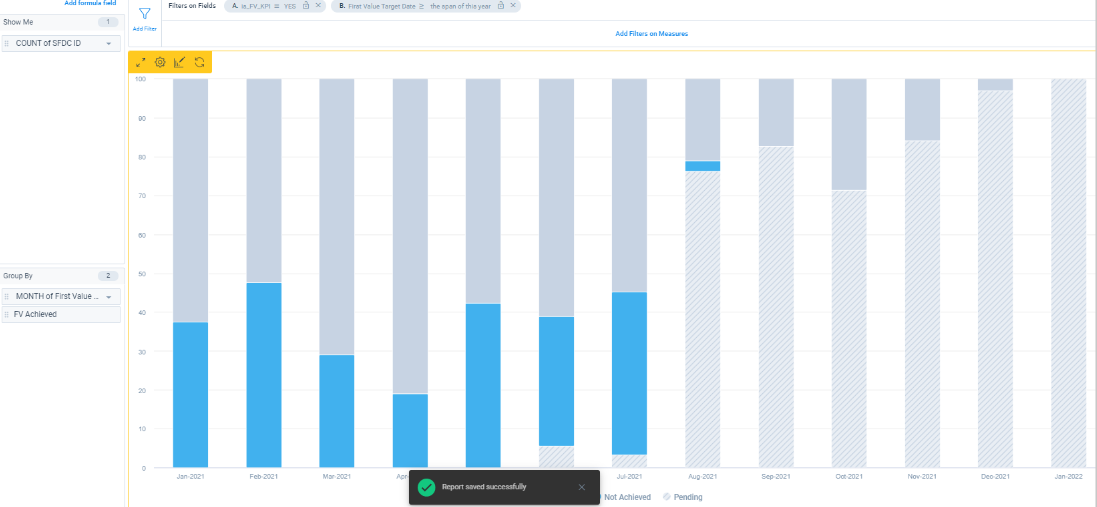
I’m wondering if a common use case we have issues in the past has a possible solution now with Horizon Analytics.
We are measuring the time we take for customers to reach “First value” with our product. For that we have 3 main fields FV Achieved (y/n boolean), FV Target date (date field) and FV actual (date field).
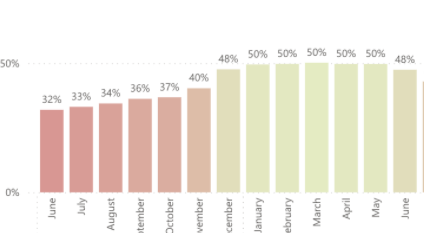
With that data we were looking to build a chart that would get us a monthly breakdown with the % of FV achieved (=true).
- X-axis - FV target date ( by month)
- y-axis - % of customers with FV achieved
Similar to this chart, built in another tool (disregarding the colors):

I think this is a typical case where in the previous report builder would have to be solved via rules engine. But does anyone know if that’s still the case for horizon?
Thanks in advance!


