Question

Creating report with accounts and features

  • 10 February 2023
  • 1 reply
  • 31 views

Hi, 

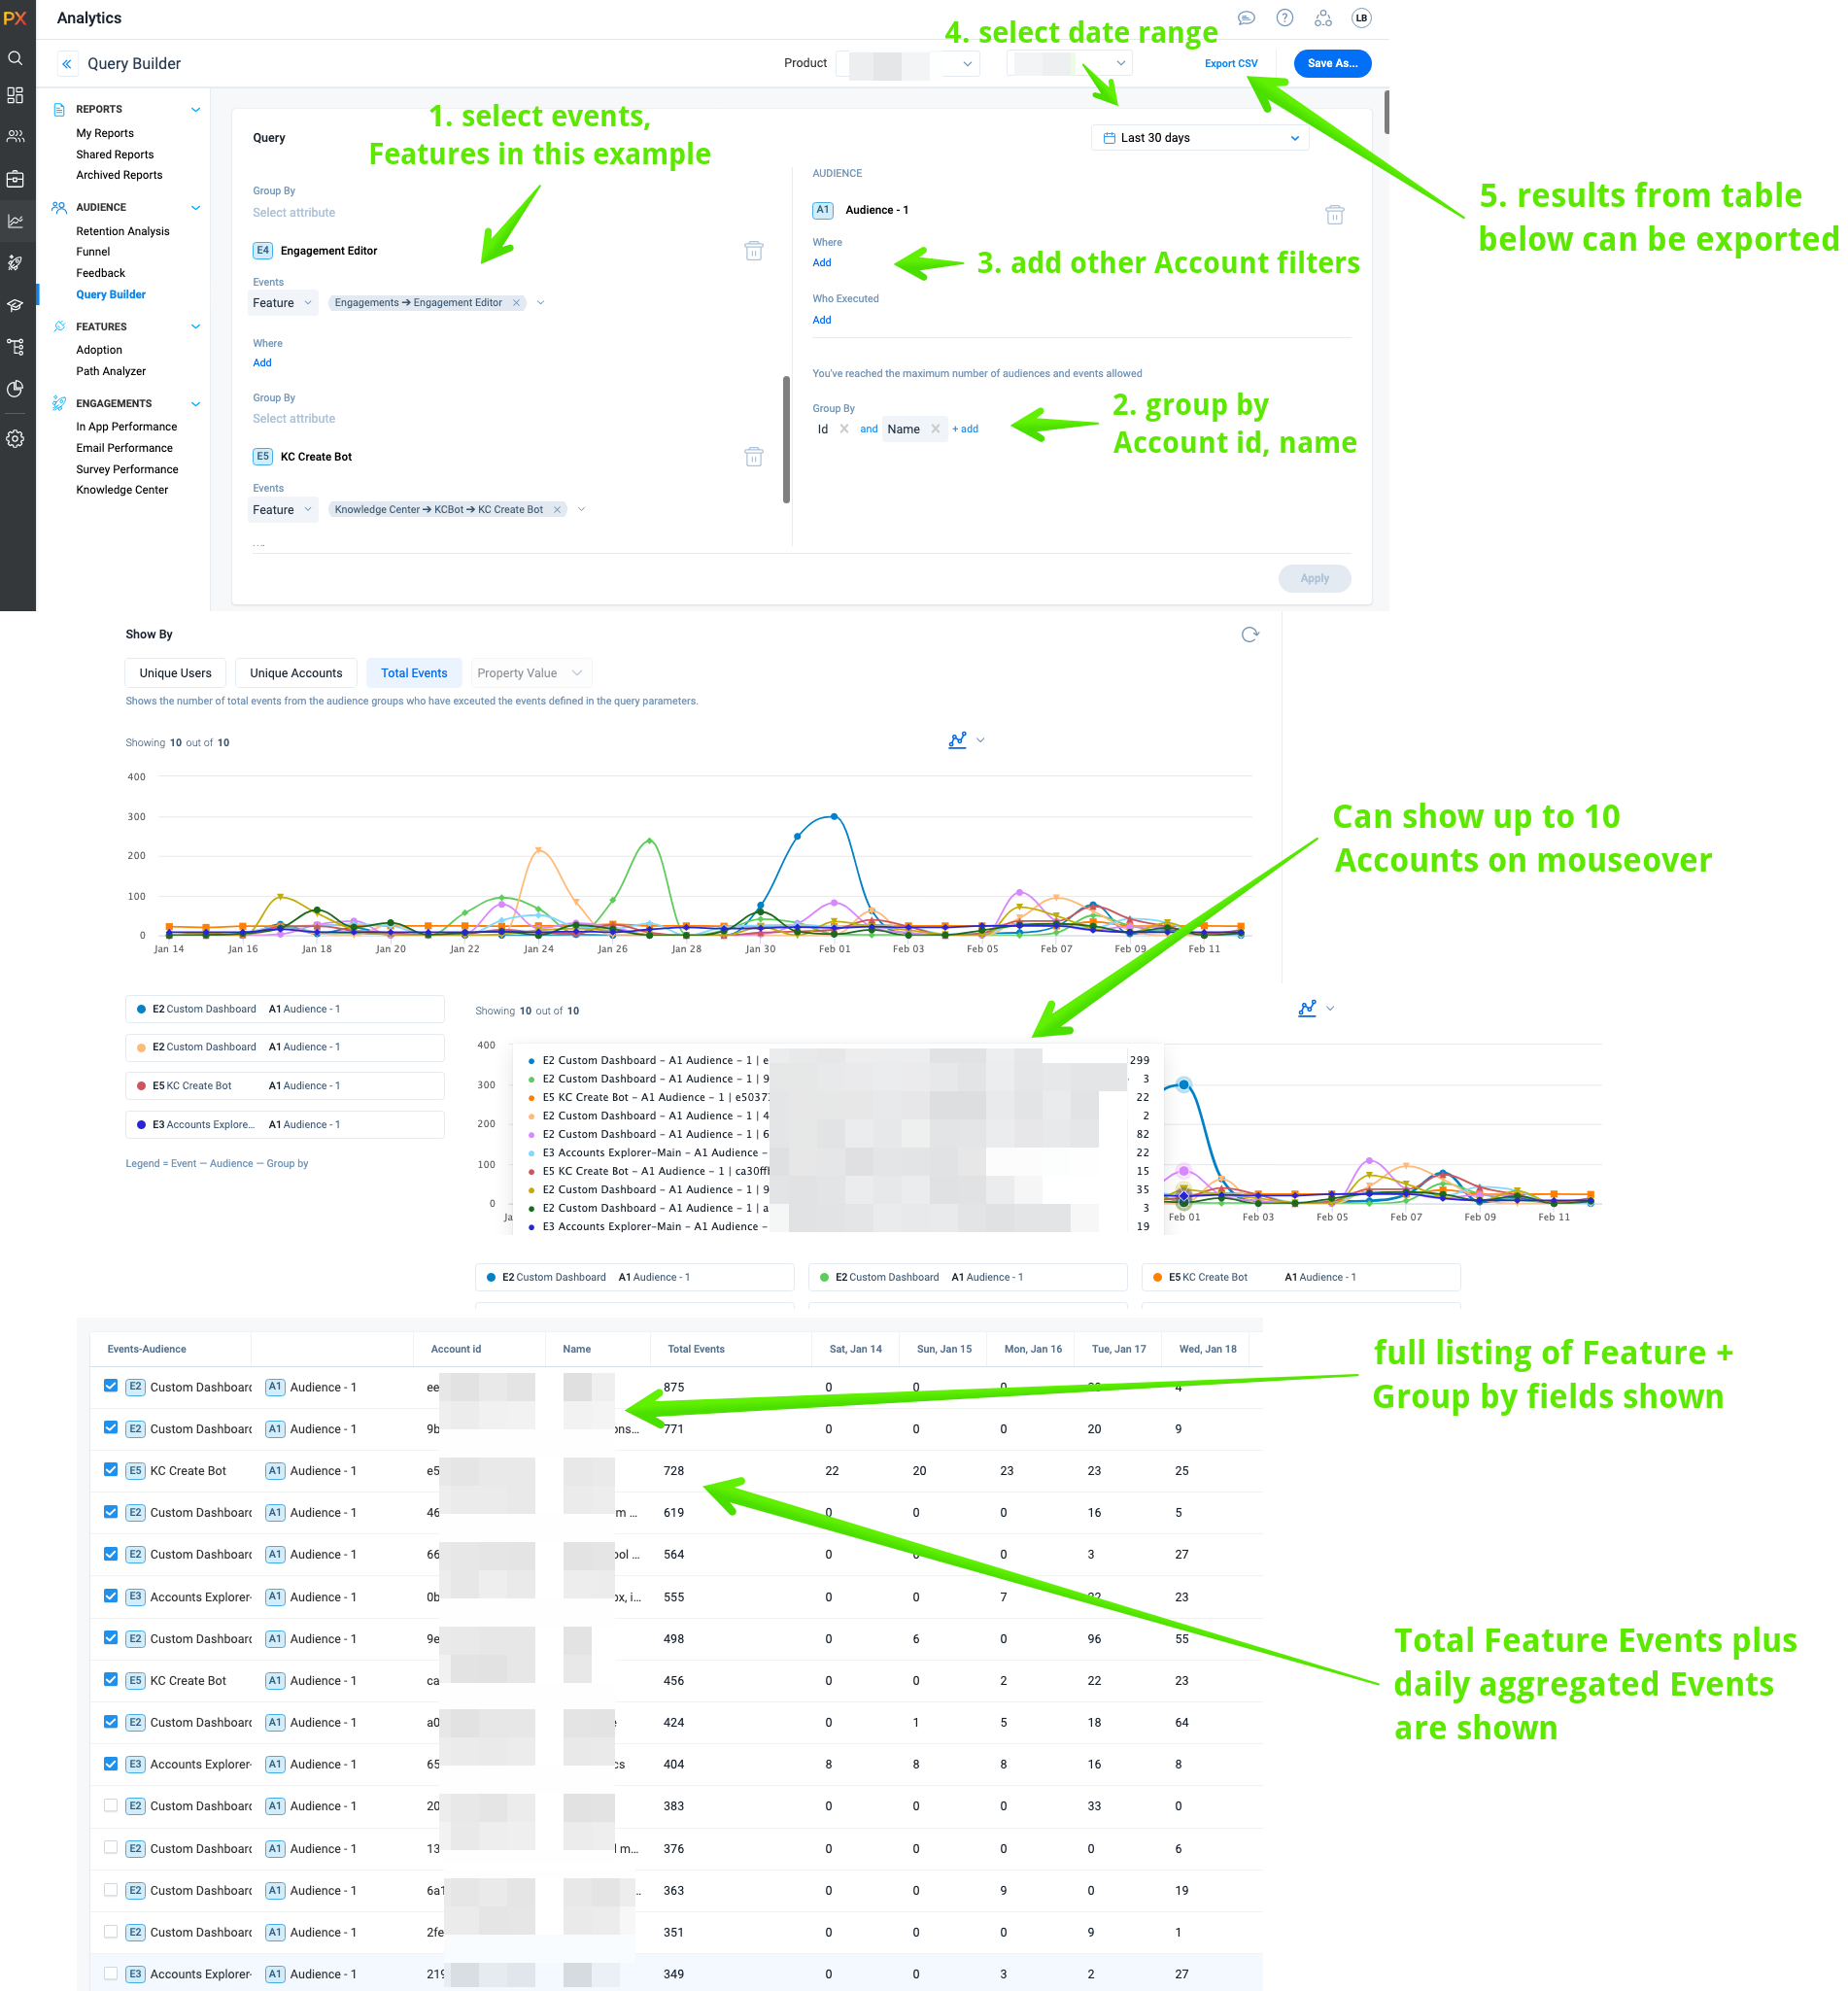
I want to create an adoption report,

  1. with all the accounts on y axis
  2. with a certain number of features on x axis

the y axis has to be exhaustive (must include all accounts)

the x axis, for example, must be features A, B, C, D, and E

time period would be a month

Scenario:

I want to see the usage of several features across all accounts. Lets say I have 100 active accounts, and I want to see the feature usage across all of them. Features for example being download of particular files from the site, differentiated as features A, B, C, etc. 


How can I create this report? I see that in most reports the x axis is always a time line. instead of having a timeline on x axis can we have a number of features?

Thanks for posting to PX Community @rexdavid !


You cannot currently get a graphical display with all that data the way that you describe above within PX.


However, using PX Query Builder as shown below should help with many of the necessary insights.  Plus, you can definitely get and even export a tabular listing of all accounts, features, and events.  See example below:


You can also use the Feature Adoption Analysis report, grouped by Accounts, to show the top/bottom 10 Accounts based on Module/Feature mappings in your Product Map.  See sample below:


I know this is not exactly and/or everything that you want, but it surely should help in your analysis.


Happy PX-ing!


Reply