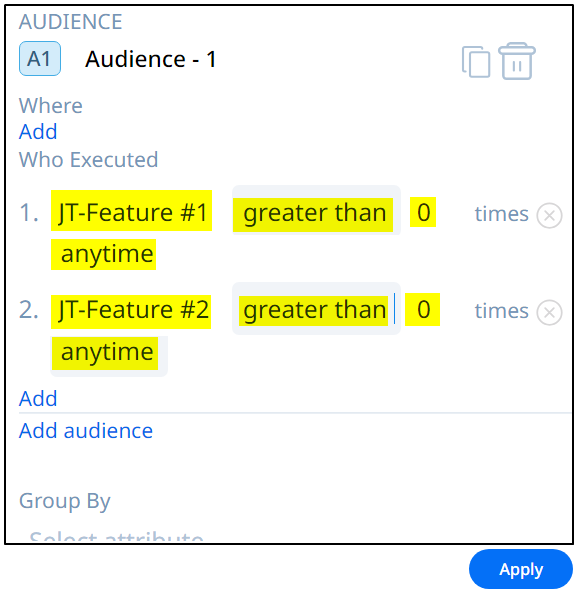
My Product Managers would like to know when Users have completed a series of tasks/steps e.g., clicked two or more mapped features.
These Features are “connected” by the logical AND statement.
For example, how can I get a count of Users that clicked (Feature A) AND (Feature B) AND (Feature C)?
The Funnel report accomplishes this and I’ve considered it.
But, the Funnel report doesn’t present its results in a line graph format, per day, per week, etc.
I was hoping to create a line graph that showed ONLY the count of Users that completed the specified Features (steps).
I know I can enter multiple Rules under a single Feature.
I also know I can enter multiple Features under a Module.
However, the Rules under a Function are logically evaluated using BOOLEAN “OR” logic.
Similarly, Functions under a Modules are logically evaluated using BOOLEAN “OR” logic.
For example,
Suppose we have a Feature that has two Rules, Rule 1 and Rule 2.
If Rule 1 is TRUE, then the Feature is TRUE (counted),
-OR-
If Rule 2 is TRUE, then the Feature is TRUE (counted).
I’m struggling to create a BOOLEAN “AND” logical function.
Does anyone know of a way that I can evaluate two or more Rules using the BOOLEAN “AND” logic?
Or, is there any way to to evaluate two or more Functions using the BOOLEAN “AND” logic?
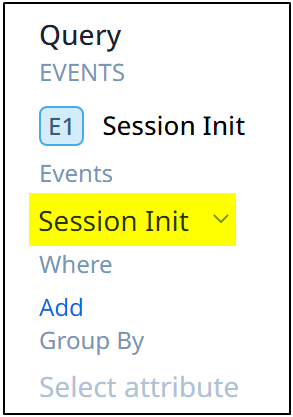
I was told to try the Query Builder.
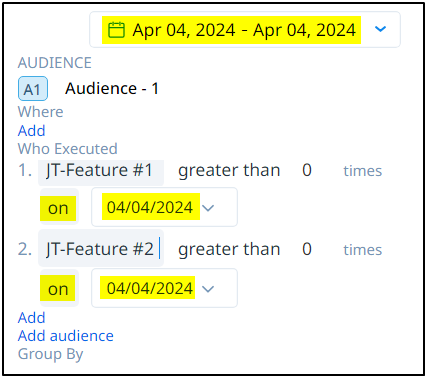
I created two Events.
But when I clicked the “Apply” button, my two events graphed as two separate line graphs.
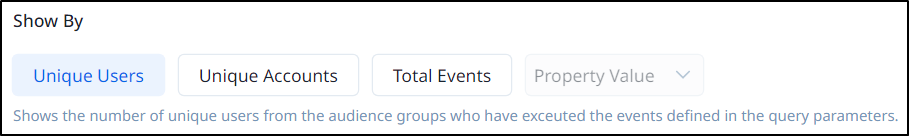
I’m looking for one line graph that gives the number of Unique Users that completed BOTH events,
-OR-
The number of Events where Each User completed BOTH events.
Your suggestions will be greatly appreciated.
Thank you kindly.
John