
Hi everyone, 

We are trying to create more advanced reporting specifically on engagement and I wanted to crowdsource some ideas & hear your best practices. 

We, unfortunately, don’t use Salesforce (pipedrive instead) so we don’t see any analytics reported out of the box.

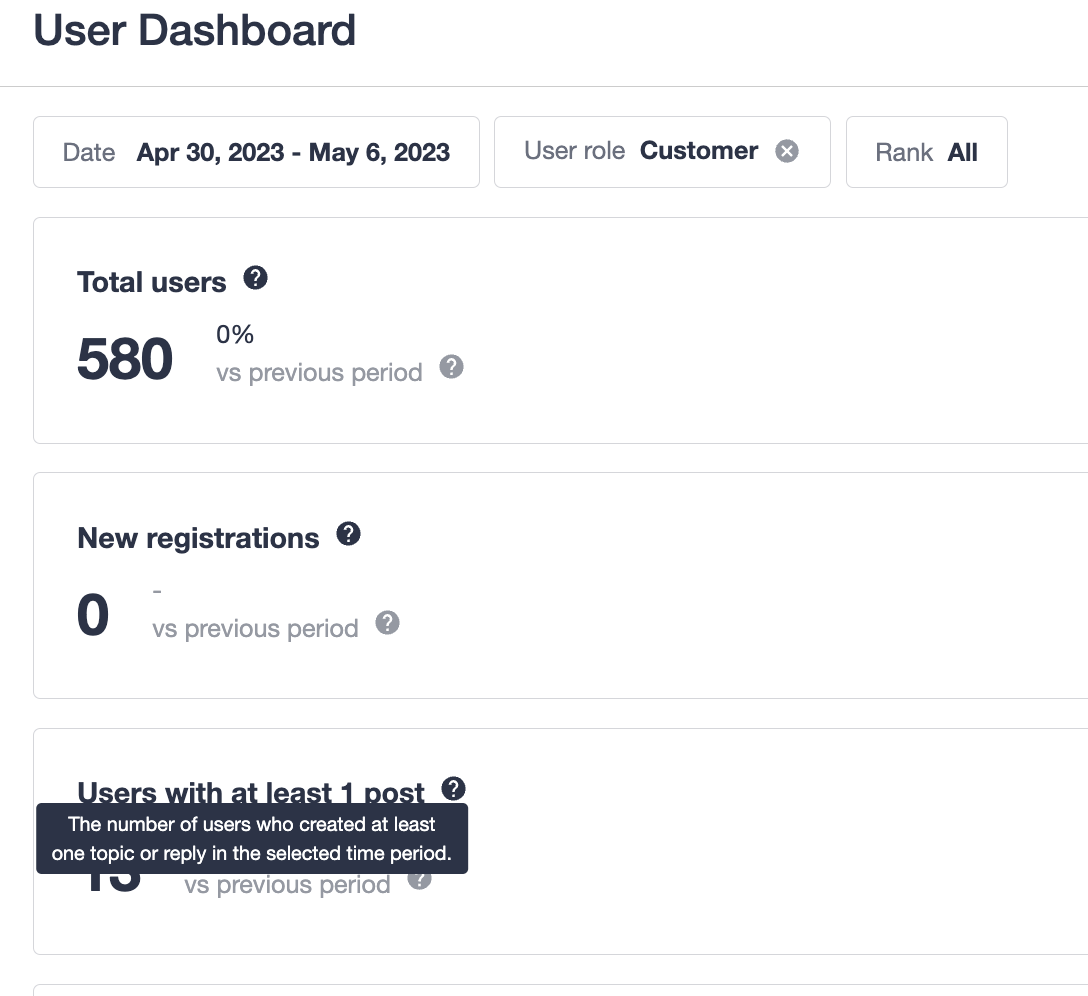
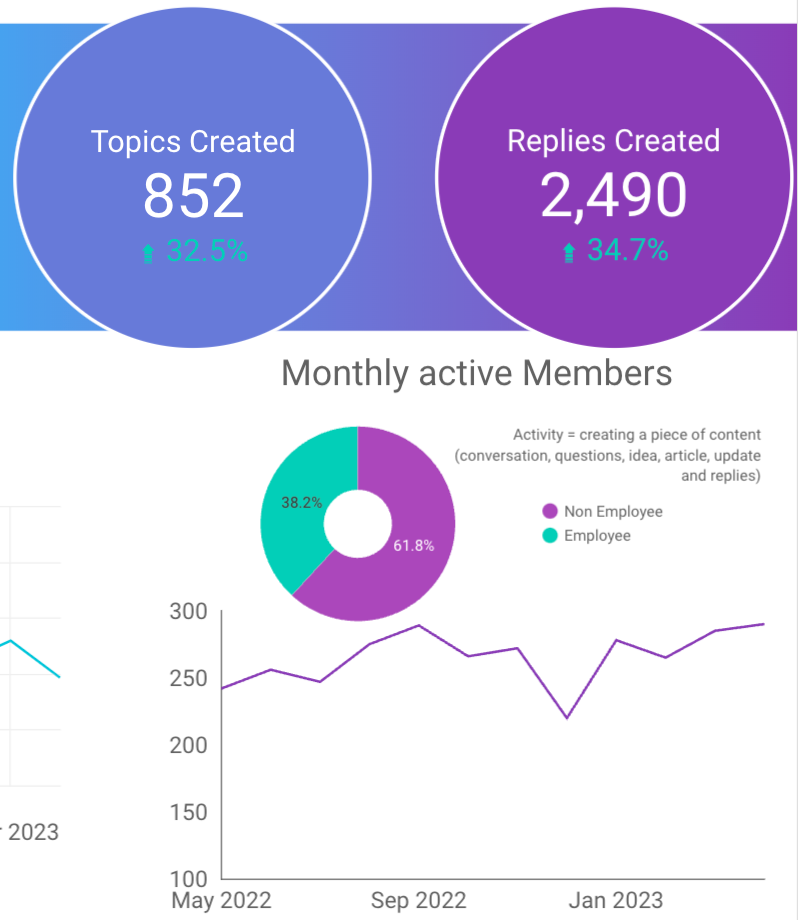
We would like to see Weekly Returning Users (that are from specific custom user roles, ie. not employees who are members of the community) and Weekly Active Users (we have defined this as a user who takes an action on the community such as like, comment, post). 

Any ideas on how to achieve this without having to compile everything on excel with multiple formulas and endless rows? 😅

Thank you!

Hi @Cansu 

I can start with Weekly Active Users.

This is obtainably from the USER Dashboard in the platform. 

The metric of Users with at least 1 Post would be defined as active. You can also apply Role Filters to narrow down the results.


You can also use the POST export and in your BI tool count the unique post creators to achieve the same thing. I am doing this in Looker for example. 


As for Returning Users by role. 

What you CAN do is use the LOGIN Export from analytics. This will give you all the instances of log in events, INCLUDING the user roles.

You can then dissect the role as you wish.

**** Word of caution though. If someone remains logged in from one week to the next, they will only be counted in the original log in event. Even if they go on to post and write in later weeks. ****


The new-ish Segments tool that’s in beta will be key to helping you track some of these. See if you can get added to the Beta if you’re not already. But it’s also been in beta for awhile and I suspect may be GA soon. 

Depending on how you define Weekly Returning Users (is it returned from the previous week, or just returned from ever / didn’t sign up that week?) you should be able to do something there. 

If it’s the latter, you can build a segment that filters users that

  • Registration date is greater than 7 days ago
  • Last activity date is less than 7 days ago

If it’s the former and you’re looking to time box calendar week activity and look at how that’s growing… I think you could do use the Audience dashboard as a simple way to look at that, but it won’t be perfect. 

  • Unique registered visitors are people who visit (doesn’t mean they log in) during that time period who have a username. They use a tracking cookie for this and match that cookie to usernames when someone logs in. 
  • Note: This is what I call a “dynamic” metric in Insided, which means what you see for a time period may change. If an unknown guest visitor visits today and then comes back next week and registers, it will match up the cookie and the next time you look at this week they’d be included as a register visitor. 
    • So you’d need to manually capture the data point if you want to keep that metric static. 

If you’re looking to go week-to-week, Segments could help you there too with a more complicated solution. Segments has a bulk action to assign them a custom user role. So you could assign them the role for “active last week” to track. Your custom user roles will pile up unless you clear those out after a few weeks.  


Reply