Is there a way to create a report that shows accounts that were At Risk (health score of less than 80) each week for the last 3 months? I tried using the Account Scorecard History object to create this but there’s only Current Score and Previous Score and those only show me the current week and last week’s score.
At Risk Score - Last 3 Months Reporting
Best answer by Wayne
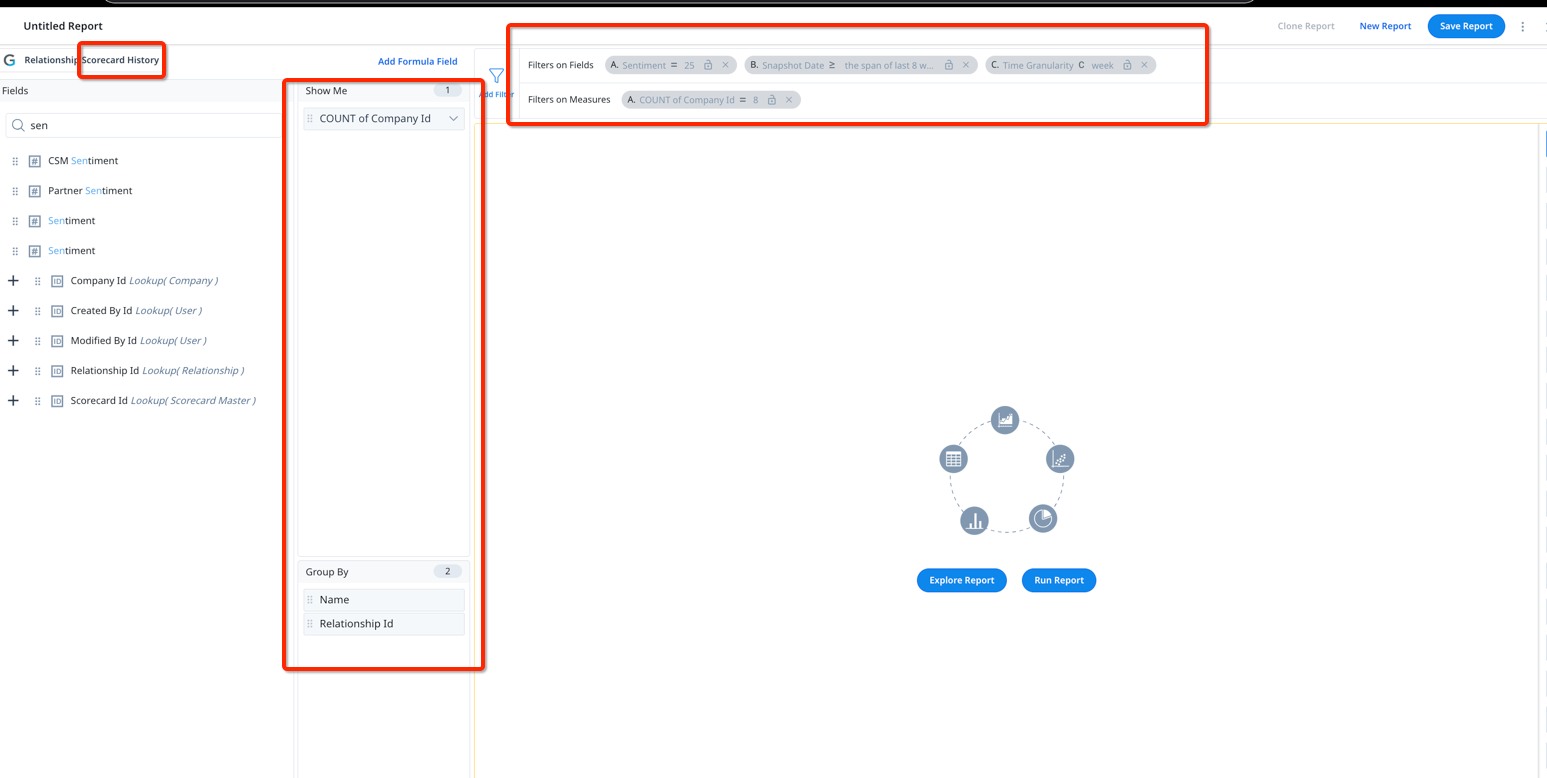
Here’s a Mock up of what you want.
You need to use a scorecard history object, most likely company/account if you don’t have R360s.
Then you need to put a random field in the show me to be counted and your Company name field in the group by.
Then you have to apply these filters. The sentiment filter is the SC measure you are wanting to see less than a certain number.
Snapshot Date is for however many weeks you are wanting to consider for, so past 12 for 3 months.
Granularity is because the history table tracks both weekly and monthly in the same table so we want to ignore monthly.
Lastly you apply a filter on the field you are counting for however many weeks you ar elooking at, this case 12.
What you are essentially doing is saying, give me a count of the amount of records of a particular score by account below a certain amount. If that count is 12 then show it to me.

Sign up
If you ever had a profile with us, there's no need to create another one.
Don't worry if your email address has since changed, or you can't remember your login, just let us know at community@gainsight.com and we'll help you get started from where you left.
Else, please continue with the registration below.
Welcome to the Gainsight Community
Enter your E-mail address. We'll send you an e-mail with instructions to reset your password.

