These are a summary of (mostly coherent) notes I took during a call with Gainsight Engineering about this object. At the time, we were not fully migrated to Horizon Analytics:
Current setup is Gainsight NXT accessed via SFDC. We do NOT have GS Home in this instance so I don''t know how that impacts usage here, nor are we fully deployed on HA. However, you do need HA enabled at least in Beta for access to this object (GS Asset Usage Tracking).
Generally, these are the questions the object is designed to be able to answer:
-What assets are or aren''t being used?
-What features/assets are CSMs end/users using?
Caveats:
• This object does NOT provide a trend sort of view. The time component will only really provide how recently something was visited, and show you what assets you have that are stale.
• Trending over time was beyond the scope of the object, due to the data storage volume growing at a geometric rate (not their words, but it would be very high volume) based on number of users, assets, and unique combinations of access pathways and CRUD options.
Fields:
API Version: can pretty much be ignored, it''s primarily for GS internally. However, V3 roughly = HA reporting/analytics. I don''t want to mislabel them so I''ll leave it at that.
Source Type: This field is also mostly for GS internally for now (based on the field values). But, know that the different MDA types generally correspond to the object type and where that data is stored. If you want visibility on SFDC vs MDA object usage you can leverage a filter for "contains MDA" to group the MDA ones together. I believe all SFDC is just SFDC. Given a particular asset, this value should be consistent even if accessed differently (i.e. different Request Source)
Event Type: Values are your basic CRUD actions (Create, Run, Update, Delete) PLUS Clone and Share.
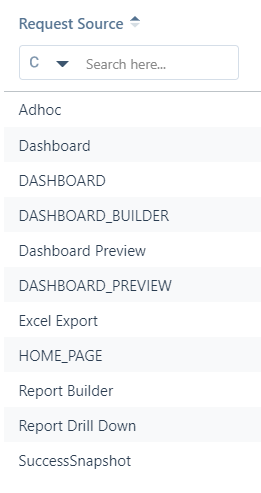
Request Source field: This basically tells you how the asset was accessed during a "session".

Below are additional values I did not have, but you may see:
• PDF Download
• External Sharing
• Marking as Favorite
• GS_Home
• C360
Dashboard/DASHBOARD are the same>HA will only use DASHBOARD
Home_PAGE is the "home" button if GS Home is not enabled
Note: This is not an exhaustive list of the options. There may be others not captured here yet as well. There should be one for Quick Insights (Gainsight Sally usage) but we do not use that, so I’m uncertain what it would look like.
Adhoc is evidently a Gainsight internal term we needn’t concern ourselves with.
Last Used Timestamp: This is in fact what it sounds like - it is the last time something was accessed.
Asset ID: This differentiates between assets with the same name created off of clones, etc. The GSID of the object e.g it''s location in memory.
Event Count: This is a rolling aggregate of times you have accessed a particular asset in a particular manner (more on that later).
Some of the usage is better explained with some examples. These aren''t exhaustive but hopefully enough to give an understanding of what your data might look like, when your Event Count goes up, and when a new record is created for a user even if they''re accessing the same Asset ID.

In the above, these all have the same Asset ID. Event count goes up N+1 when the same combination of values for all fields for that Asset ID are the same. Otherwise, a new record (line item) is created.
In the above, you can see that I RAN this dashboard 37 times via the builder with my last access on the 26th.
I RAN it via DASHBOARD (I believe the left side ribbon button) 104 times with my last access on the 28th.
I also did 53 Updates!
Were I to share the dashboard from say, DASHBOARD (assuming we know what that is) a new record here would be created. But, accessing the dash via the dashboard builder would uptick my event count and rewrite the Last Used Timestamp for that top row record.
Other Common Scenarios:
I''ll preface this by saying that lazy loading impacts your record counts. The following assumes your reports load properly.
If you access a dashboard with lazy loading OFF, the dashboard count would go up N+1. All the reports on that dashboard ALSO go up N+1.
If you access a dashboard with lazy loading ON, the dashboard count goes up N+1 but only the reports that actually loaded receive an N+1 for their Event Count.
If you refresh a report (on a dashboard), futz with the filters, that increases the Even Count for that asset.
Report drill downs increase Even Count but, as mentioned above, it counts as it''s own Request Source, so it would only increase Event Count for that particular record.
Expanding a report ''full screen'' (HA only) increases Event Count but is not its own Source/Event Type
Note: If you delete an asset, none of that data will be erased in this object, and you will have no direct way to filter out deleted assets. There is a request to add a ‘deleted’ boolean field for easier filtering here:
'


