does any one have any reports built that currently show the aging of a CTA grouped by status?  if not recommendations on best way to build that out 🙂
Hi Kiersti,


I might recommend using CTA Created Date instead of the CTA Age field for your report. This would give you a timeline view of CTAs based on their created date and what status they are currently in, which I think will ultimately be the same information you are looking for possibly.


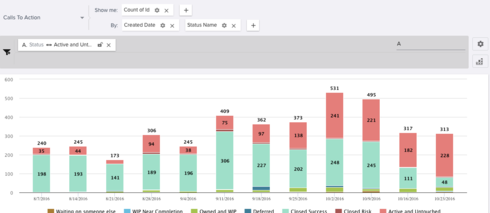
In the below screenshot I sourced the Call to Action object, then put CTA::ID in the Show, CTA::Created Date (summarized by Week) and CTA::Status Name in the By and visualized it as a Stacked Column. This is not only showing you how many CTAs are still open from a month or two ago, but also how the total CTAs are trending week over week.


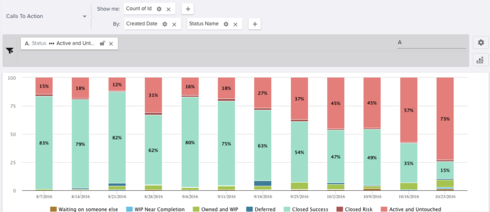
Or you could turn on the Chart Option "Show Percentage" to see a better trend of CTAs statuses.There are more Closed Success in older weeks and more Active in nearer weeks.


Let me know if you have any questions or if this doesn't accomplish what you are looking for!

Reply