Hi everyone! 

Community associate here with admittedly very little experience in analytics and tracking. I currently manage a support community for a software company that serves small businesses.

I was wondering if anyone had a google sheet (or other) template they would be willing to share that could help me measure engagement, user growth, topics created, replies, likes, trending topics, etc.

I’m also admittedly bad at excel and sheets 😅 and would love any and all suggestions even if you don’t have a template to share. The analytics dashboard in Digital Hub is mighty though very intimidating and I’d love to catch weekly and monthly numbers but am terrible at creating sheets.

Thank you so much in advance to anyone who can help!
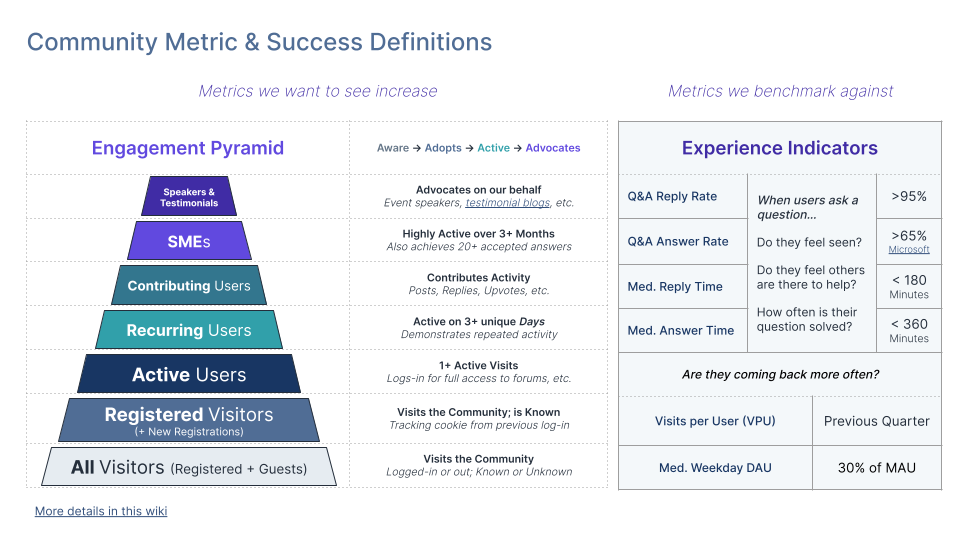
@jay_honeybook is your company using salesforce and the salesforce integration? 


Here’s how I look at things. Most of these metrics I get from Salesforce reports of user activities from the community. Some others (median time to reply) I had our data team put together in tableau dashboards using the REST API (there’s no easy way to do this with the .csv exports)


I shared a bit about these in this post: 


And here’s another idea I’m working on for this year, leveraging the out-of-the-box User Analytics dashboard


Finally, I’m also using Google Analytics to track the traffic generated by the community to our documentation site and training academy. Neither of those are on our Gainsight CC, but we’ve integrated them in via federated search and link out to them in navigation and quick links on our home page. 


Hey @DannyPancratz 


This is helpful, thanks for sharing! Unfortunately, we are not using Salesforce.


i was thinking of creating a more manual tracker in sheets/excel to show those WoW/MoM changes in community composition and engagement. Maybe something a bit simpler as I’d need to share this with XFN partners so hoping to make this a little more digestible visually 😅


Reply