

The first Analytics Dashboard is live!
Hi all!
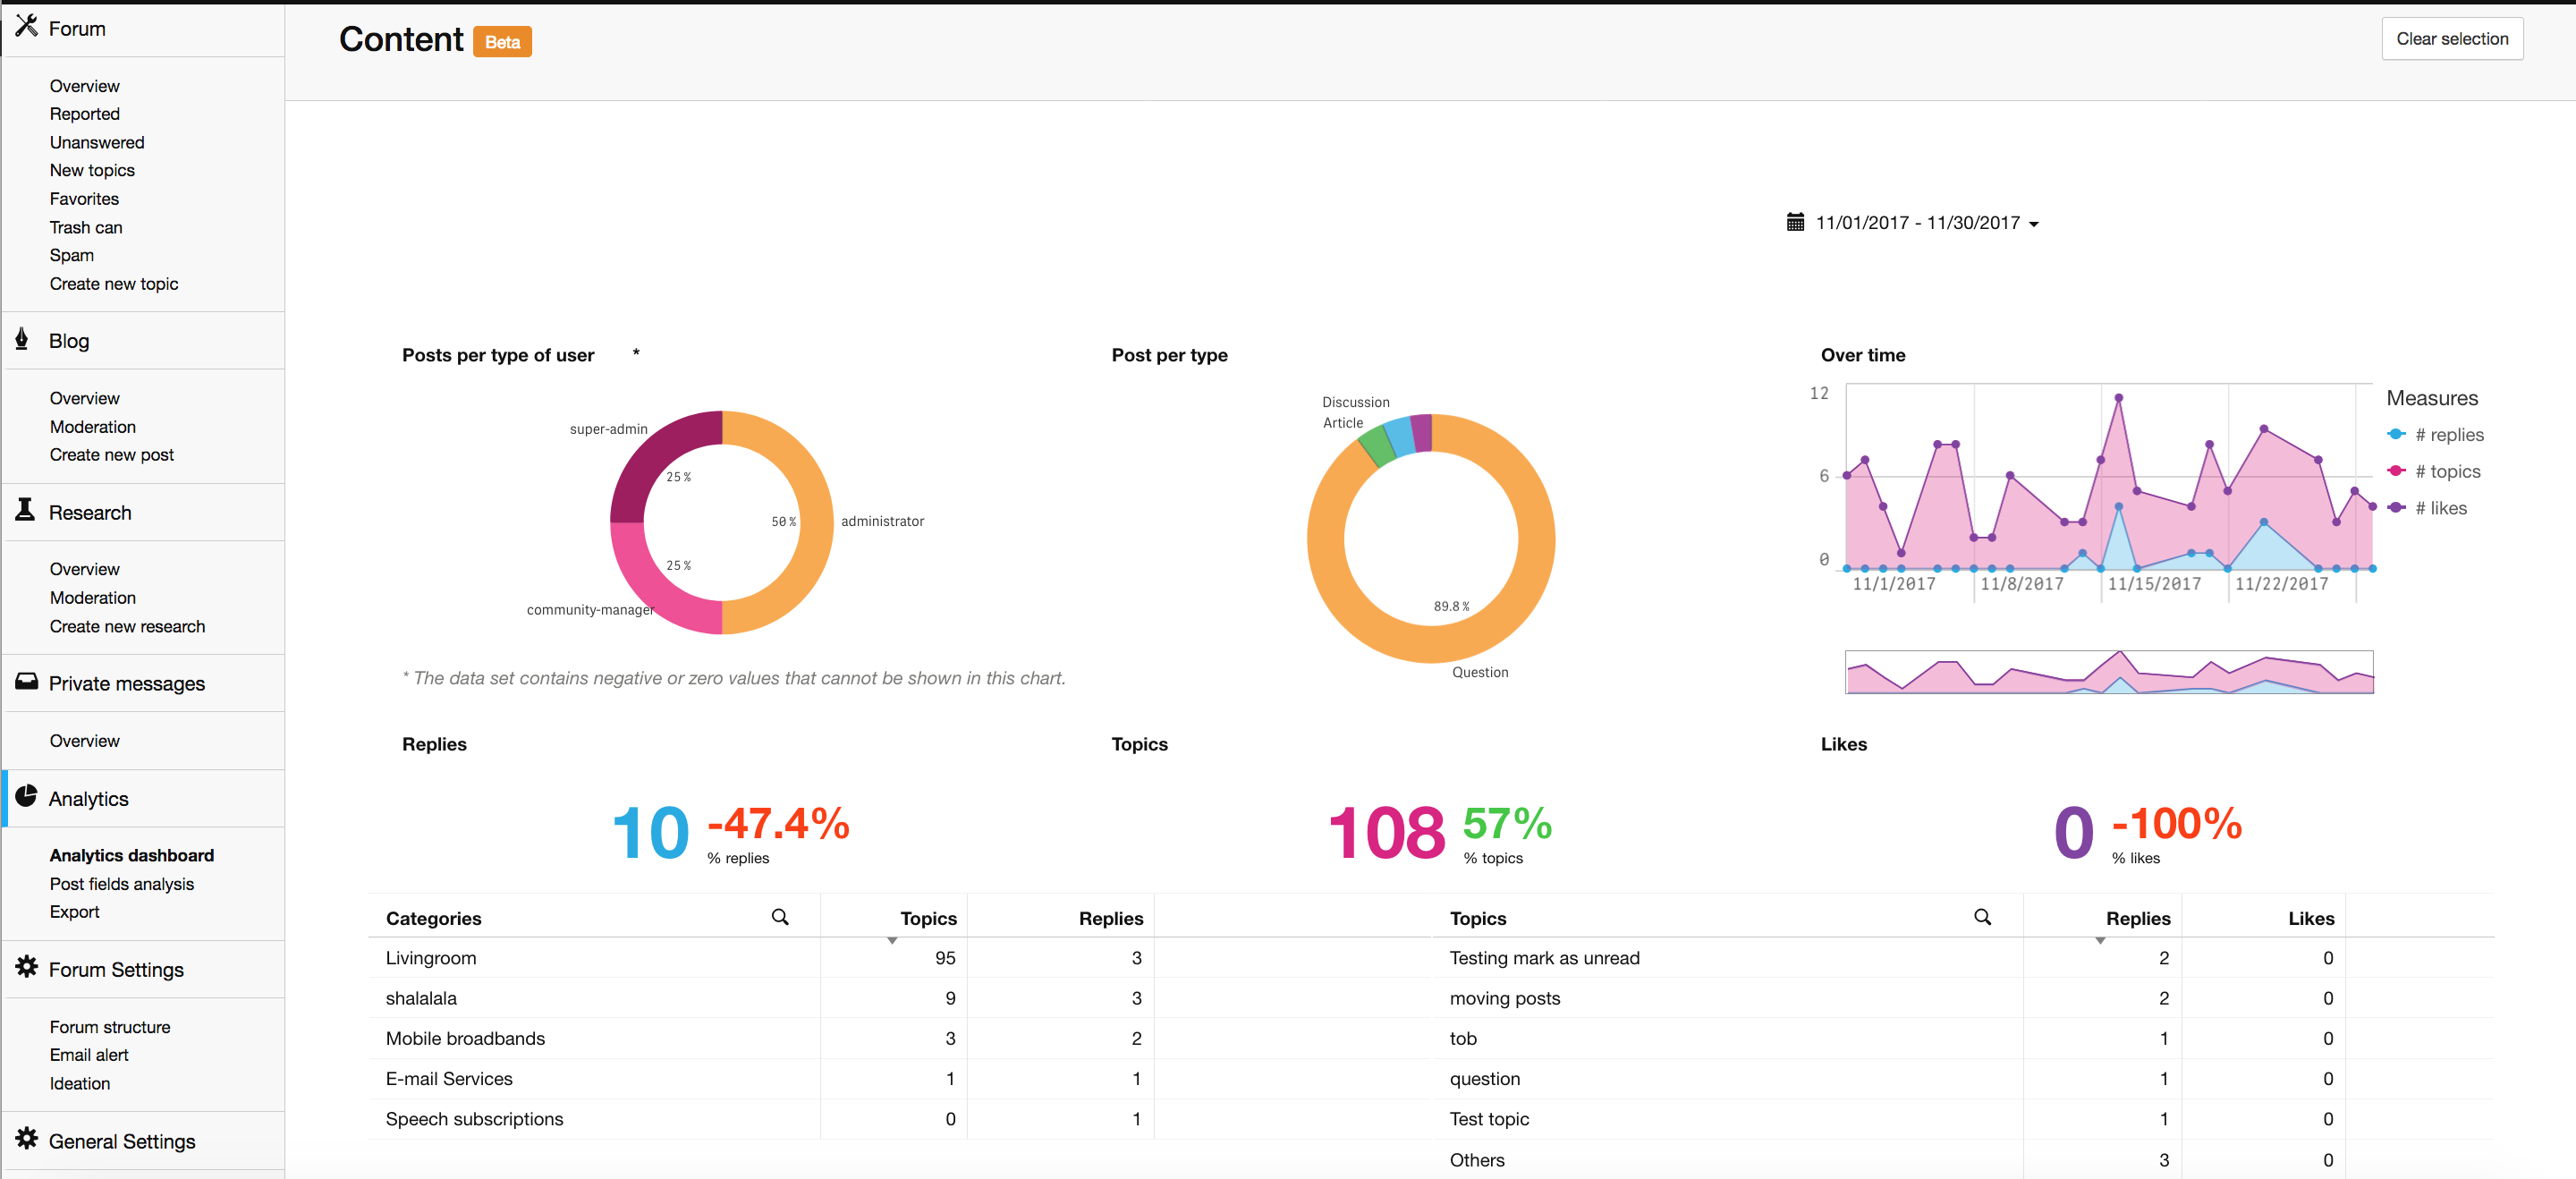
As we want to leave this year with a bang, we just have released our very first Analytics Dashboard for all of you! :)
You are able to find it in the Analytics section of your control environment:
Some communities are still in the process of synchronizing the data base, so if you encounter issues accessing the dashboard, then this probably can be explained by that.
This first release is very important to us, now the ground work has been done to release more dashboards in the upcoming months. We already received quite innovative ideas for future dashboards, please keep providing us with your awesome feedback!
As we plan to move all exports to this new page at a later stage, maybe you can also share your current cases for doing exports? This way we can optimize our plans to deliver the best experience possible!
Please note: You might get a login-prompt when you click on the dashboard. You can simply abort it, you don't need to log in. ;)
If there should be any issues while using the dashboard, then simply reload the page. That will do the trick in most of the cases. Should you encounter anything that looks like a bug to you, please inform my colleagues from support!
Of course I am excited to hear your thoughts on this! If you should have questions, I will do my very best to answer them. ;)
Last but not least, I want to wish all of you a joyful ending of this year and an awesome start in 2018!
Cheers,
Julian
As we want to leave this year with a bang, we just have released our very first Analytics Dashboard for all of you! :)
You are able to find it in the Analytics section of your control environment:
Some communities are still in the process of synchronizing the data base, so if you encounter issues accessing the dashboard, then this probably can be explained by that.
This first release is very important to us, now the ground work has been done to release more dashboards in the upcoming months. We already received quite innovative ideas for future dashboards, please keep providing us with your awesome feedback!
As we plan to move all exports to this new page at a later stage, maybe you can also share your current cases for doing exports? This way we can optimize our plans to deliver the best experience possible!
Please note: You might get a login-prompt when you click on the dashboard. You can simply abort it, you don't need to log in. ;)
If there should be any issues while using the dashboard, then simply reload the page. That will do the trick in most of the cases. Should you encounter anything that looks like a bug to you, please inform my colleagues from support!
Of course I am excited to hear your thoughts on this! If you should have questions, I will do my very best to answer them. ;)
Last but not least, I want to wish all of you a joyful ending of this year and an awesome start in 2018!
Cheers,
Julian