Our CSM's use CTA's to track updates that are made to our customer's programs.
For example - a CTA type would be "Program Update" and Reason: "Increase Reward"
We also are using the MDA to pull in data for an object called "Submissions"
Hence when CSM's increase the reward for a customer's program -- A customer's submission volume should be expected to increase.
This is all done on the relationship level. I'm looking to create a report that can show a historical view of when CTA/program updates were made and the submission data as well.
This can graphically give us a story of us showing value to our customers.
Any advice?
Solved
Help Wanted: Create a report with MDA data and CTA type/reason

Best answer by manu_mittal
Thanks for posting, Tony!
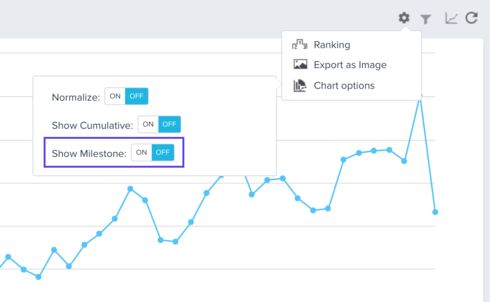
If you want to look at this data one Customer or Relationship at a time, and you are flagging these CTAs as Milestones, then one thing you could try out immediately is overlaying these Milestones on a trend report built on 'Submissions'. This should enable you to do some visual correlation between reward increments and submission volume.
Also, this month we are making statistical functions available in Bionic Rules, which you could use to perform more concrete analysis.
Hope this helps!
View originalIf you want to look at this data one Customer or Relationship at a time, and you are flagging these CTAs as Milestones, then one thing you could try out immediately is overlaying these Milestones on a trend report built on 'Submissions'. This should enable you to do some visual correlation between reward increments and submission volume.
Also, this month we are making statistical functions available in Bionic Rules, which you could use to perform more concrete analysis.
Hope this helps!
2 people like this


Reply
Sign up
If you ever had a profile with us, there's no need to create another one.
Don't worry if your email address has since changed, or you can't remember your login, just let us know at community@gainsight.com and we'll help you get started from where you left.
Else, please continue with the registration below.
Welcome to the Gainsight Community
Enter your E-mail address. We'll send you an e-mail with instructions to reset your password.