CC data in CS: Reporting Use Cases


ElleShutty
Forum|alt.badge.img+4

If you’re just now tuning in, please check out my FAQ post as well as my Getting Started post regarding the CC+CS integration.

Now that you have the CC+CS integration enabled and are familiar with how to build reports using the data, you may be wondering what reports we recommend creating.

There are many ways you can use CC data in CS, ranging from the quick to implement to the more complex.

Starting use cases (Reporting):

  • Out of the box widget on C360
  • Custom “Community” tab on C360
  • Dashboards with visualizations and reports

Advanced use cases (Actions):

  • Community health score as a component of a Company’s health score
  • Triggering CTAs based on a drop/absence of Community activity
  • Using Community data in Journey Orchestrator programs

In this article I’m going to focus on the reporting use cases.


C360 Widget

This can be added to the Summary page of the C360. It contains a few key numbers and allows the user to adjust the time period it is displaying for.


Custom “Community” tab on C360

You can add a tab to the C360 to house that Company’s CC data. Recommended reports for this section include:

  • Community Posts
  • Community Users
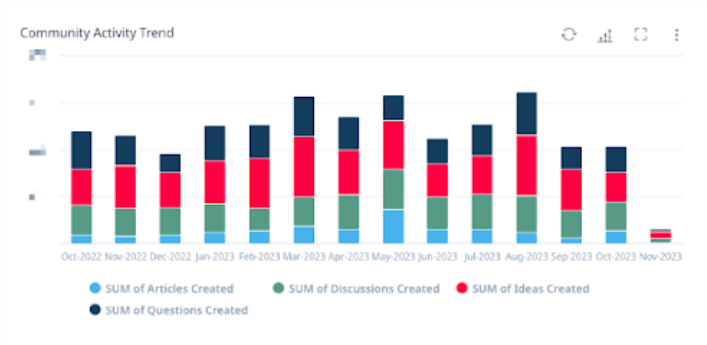
  • Community Trend

This can be helpful for a CSM to review prior to joining a call with the client. There may be a recent post they want to discuss, or they might want to note that a new member joined the Community.


Dashboards

I recommend creating different dashboards for the different personas who will be consuming this data in CS. The three I discuss below are a Community Manager, a CSM, and an Executive. You could also create a dashboard for a Product Manager, or add CC reports into an existing Product Manager dashboard.

For each of these dashboards, I asked myself these questions:

  • What questions am I looking to answer?
  • What actions do I want to drive?

Tip: To best view the dashboard screenshots, you can right click on each image and select “Open Image in New Tab” in order to zoom in and view the details.

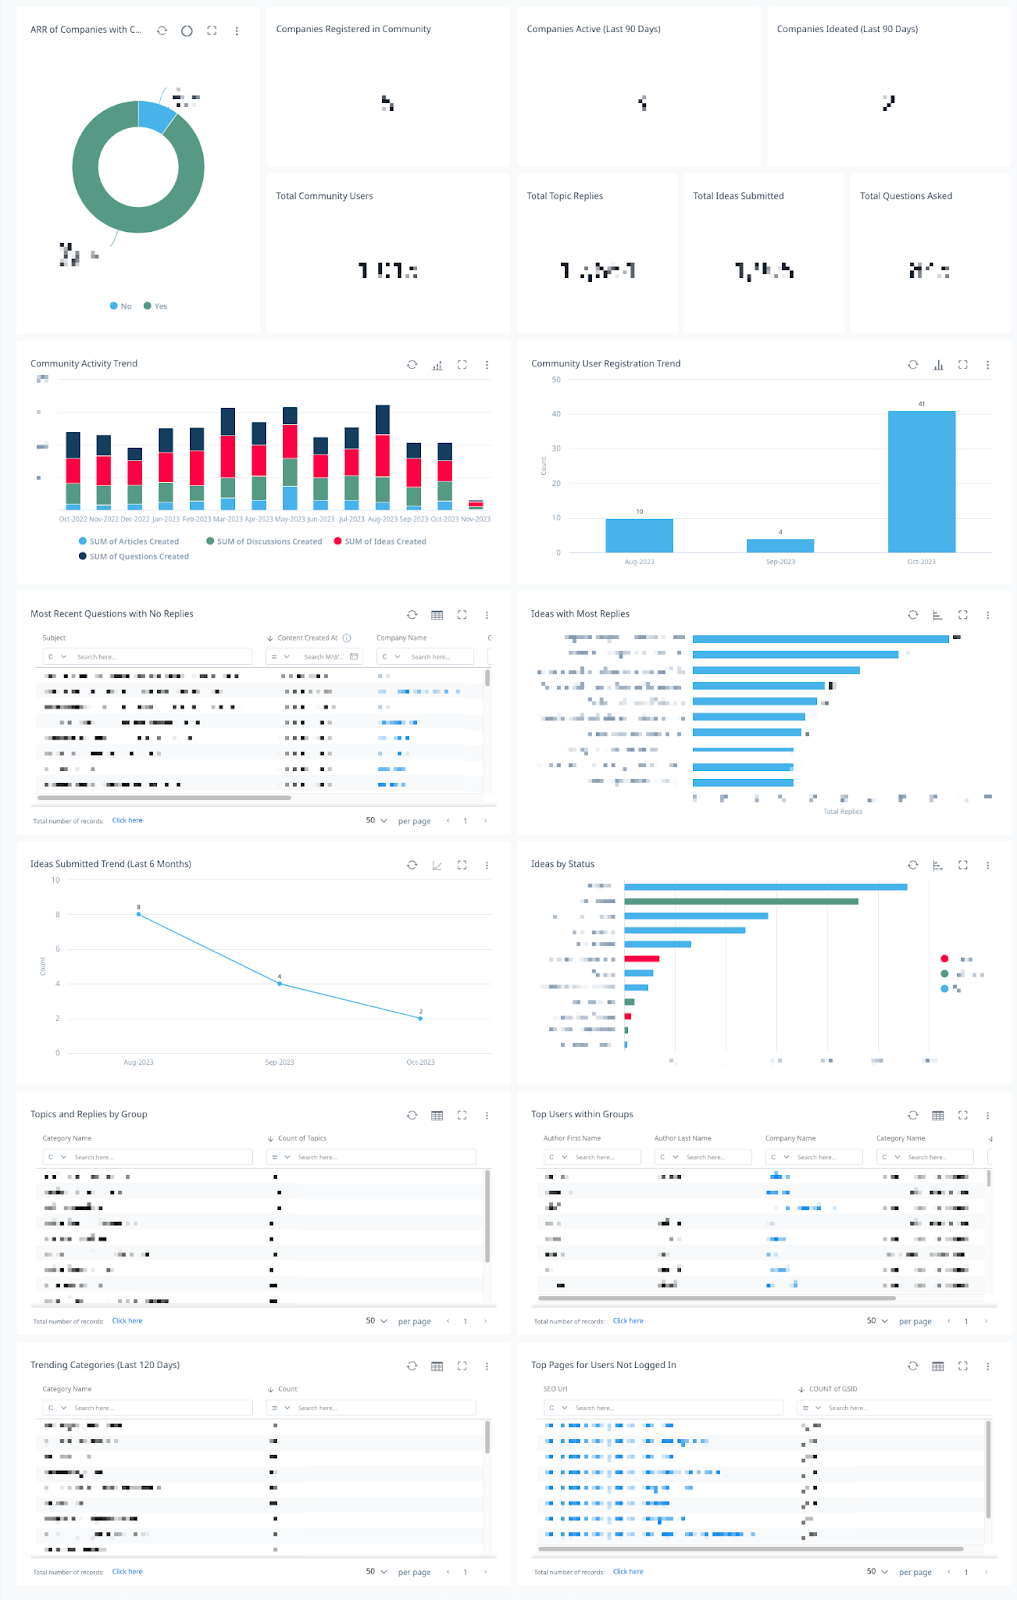
Community Manager

This dashboard helps a Community Manager see what areas are succeeding, what areas may need work, and trends across the community.
 

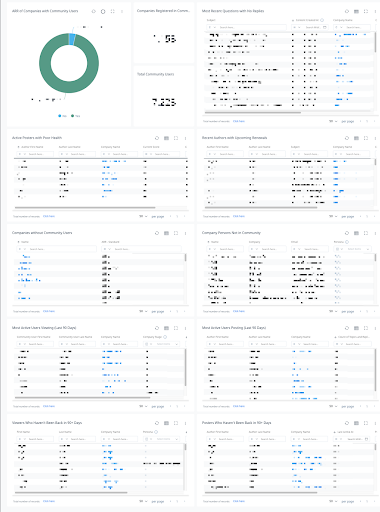
CSM

This dashboard helps a CSM monitor community activity across their book of business. It also helps surface which Companies and Contacts aren’t active in the community and might benefit from outreach.
 

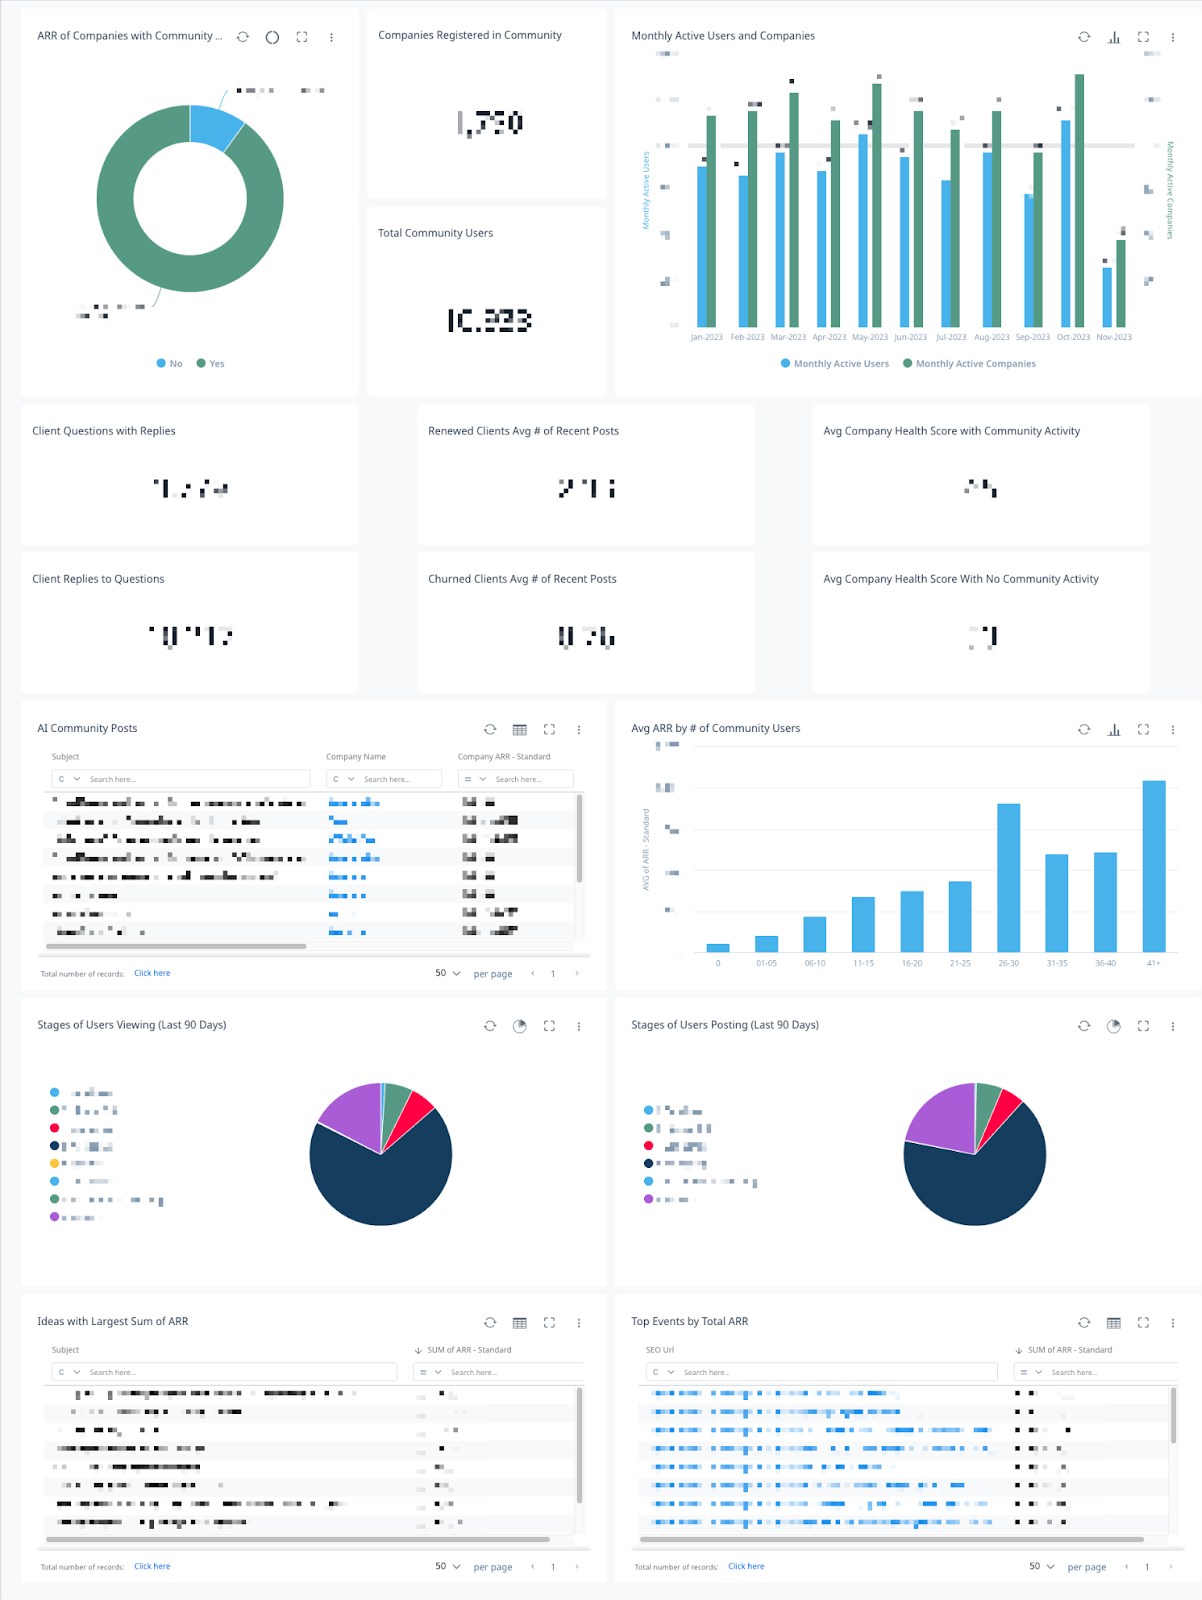
Executive

This dashboard helps an executive connect community activity to ARR, healthscores, and retention, as well as see the impact the community has on departments across the organization. For example, questions being answered in the community might be reducing Support ticket volume, and Prospect clients interacting in the community might be impacting Sales.
 

I hope this has given you something to think about wherever you’re at with your CC+CS integration. Is there anything else you’d like to see in a future article?


12 replies

jnakano
Forum|alt.badge.img+2
  • Helper ⭐️
  • 14 replies
  • February 12, 2024

This is amazing! Thanks for sharing @ElleShutty 👏

@Amanda Rothbard From our conversation earlier today, here is a great article on CC<>CS reporting use cases to give you some ideas!


vishkatti
Forum|alt.badge.img+4
  • Gainsight Employee ⭐️
  • 10 replies
  • February 13, 2024

Thank you so much for this article @ElleShutty - Super informative! 😊

@juan.delrio @sarahmasterton-brown @JKelley @tfriss - Here are some dashboards we can create using the CS <> CC integration; tagging you all since we have spoken about this in the recent past. 


JKelley
  • Helper ⭐️
  • 42 replies
  • February 13, 2024

Super helpful and thanks @vishkatti for the share!


travis_floyd
Forum|alt.badge.img+6
  • Contributor ⭐️⭐️⭐️⭐️
  • 39 replies
  • February 22, 2024

This is awesome!  Just a thought… if you could bundle up these typical reports into a Sightline Vault post, if they are built off of typical community objects and fields, then they should just work out of the box!  Download and then just tweak if needed!  Just a thought. 😀


ElleShutty
Forum|alt.badge.img+4
  • Author
  • Gainsight Employee ⭐️
  • 13 replies
  • February 22, 2024
travis_floyd wrote:

This is awesome!  Just a thought… if you could bundle up these typical reports into a Sightline Vault post, if they are built off of typical community objects and fields, then they should just work out of the box!  Download and then just tweak if needed!  Just a thought. 😀

Great idea and definitely something we’ll consider!


travis_floyd
Forum|alt.badge.img+6
  • Contributor ⭐️⭐️⭐️⭐️
  • 39 replies
  • March 13, 2024

@ell

I am trying to build these reports and dashboards for my community but I am struggling to find some of the fields I should be using for the reports you have shown… for example, the “Community Activity Trend” report, I am using the “Community Activity” object as the data source, but not seeing where these values came from.

Perhaps I am using the wrong object to build this report, or just not finding the fields needed, etc?


ElleShutty
Forum|alt.badge.img+4
  • Author
  • Gainsight Employee ⭐️
  • 13 replies
  • March 13, 2024

@travis_floyd Good question! I walk through how to create that report in this article under “Community Trend”:

I used the Community Trend object and grouped by Month of Activity Date.


travis_floyd
Forum|alt.badge.img+6
  • Contributor ⭐️⭐️⭐️⭐️
  • 39 replies
  • March 13, 2024

@ElleShutty FYI, I was able to build a similar report, but using the Community Content object, and Using Content Sub Type and Created Date as the GroupBy.  This allowed me to show more detail when drilling into the graph items to show what items were created and by whom.  I counted the GSID field, and the configured Aliases for the Content SubType values for this report, and filtered out the NULL values.  Not a big fan of my colors, so need to remap those in the Report Settings.

I am not sure if this is accurate though, as it may include more than just the Creation, but also replies.  What are your thoughts there?


ElleShutty
Forum|alt.badge.img+4
  • Author
  • Gainsight Employee ⭐️
  • 13 replies
  • March 13, 2024

@travis_floyd Yes that’s a good way to build that report if you are interested in the drilldown data. If you only want to see the count of actual posts (excluding replies) you can add a filter for Content Type = Topic. Replies have a Content Type = Reply so they would be excluded.


Forum|alt.badge.img+1
  • Helper ⭐️
  • 50 replies
  • March 20, 2025

Hi! Are there higher resolution images of the examples provided above? I’d love to take a closer look at the reports included on the CSM-focused dashboard specifically, but I’m unable to view within the post or after downloading.


AngelaBrown
Forum|alt.badge.img+3
  • Gainsight Employee ⭐️
  • 17 replies
  • March 24, 2025

Hi ​@mbuuck1! It appears that the content on the CSM Dashboard image was intentionally blurred out by the author of this post. 🙁 I was able to decipher some metric details though:

  • ARR of Companies with Community Users
  • Companies Registered in Community
  • Total Community Users
  • Most Recent Questions with No Replies 
  • Active Posters with Bad Health (Author Name, Company Name, Current Score)
  • Recent Authors with Upcoming Renewals (Author Name, Subject, Company Name)
  • Companies without Community Users (Company Name, ARR)
  • Company Persons Not in Community (Name, Company, Email, Persona) 

Not sure if you’ve seen this yet, but CS now has OOTB Community Dashboards too- you can check out the details here. Hope this helps! 


Forum|alt.badge.img+1
  • Helper ⭐️
  • 50 replies
  • March 24, 2025

@AngelaBrown Thank you! Your eyes are better than mine. 😄 Those report headers/general ideas they represent are exactly what I was hoping to see. Really appreciate your time!


Reply


Cookie policy

We use cookies to enhance and personalize your experience. If you accept you agree to our full cookie policy. Learn more about our cookies.

 
Cookie settings