New Idea

Data Labels in visualization reports should have consistent number of default decimal points

Related products:CS Reports
dstokowski
  • dstokowski
    dstokowski

sarahmiracle

Apparently, this is expected behavior and therefore an enhancement. So please upvote in order to have product parity.

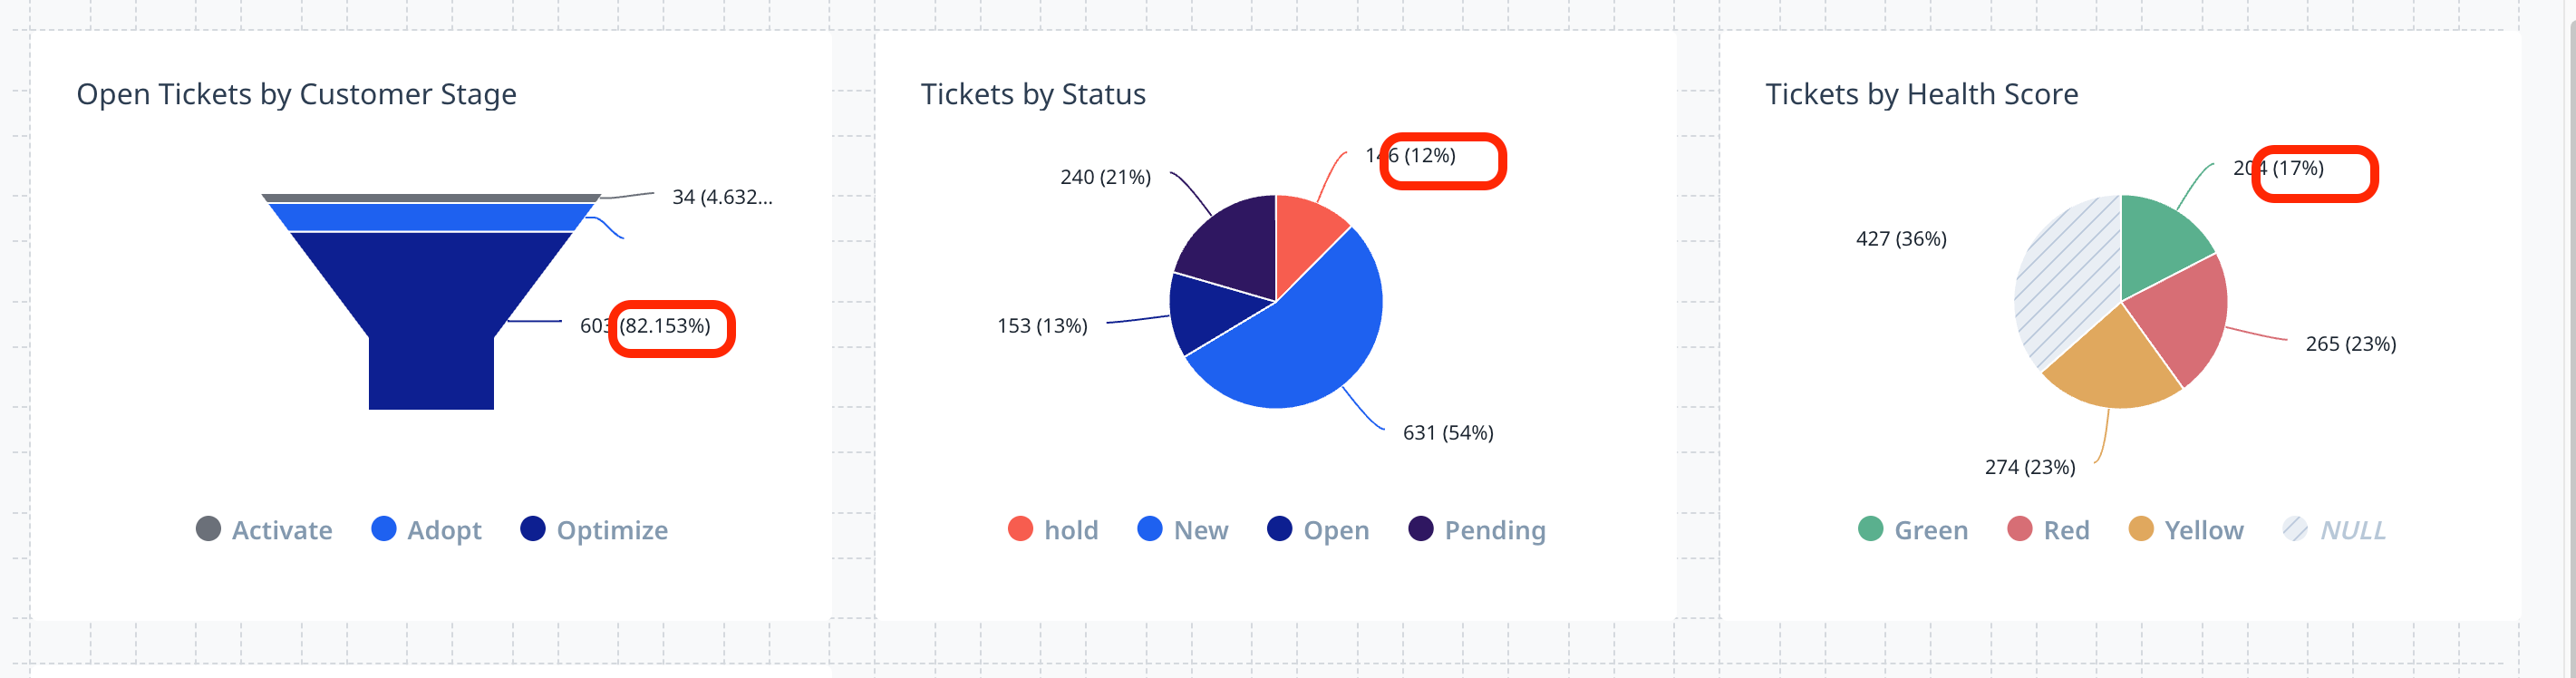
  • Funnel charts in Gainsight with data labels enabled display with 3 decimal points by default
  • All other visualization charts (pie, donut, bar, dot, line...) with data labels enabled display with 0 decimal points by default

All visualization charts data labels should have the same number of default decimal points (0).

Bonus points if you can make the default number of decimal points on data labels configurable by an admin. But even if they can just...you know...be consistent...that’d be great.


4 replies

darkknight
Forum|alt.badge.img+4
  • Expert ⭐️
  • 1980 replies
  • May 9, 2024

Feature Parity please.


darkknight
Forum|alt.badge.img+4
  • Expert ⭐️
  • 1980 replies
  • May 9, 2024

Sometimes it’s the little gaps and inconsistencies like this that make CSMs question the platform’s enterprise-readiness.


romihache
Forum|alt.badge.img+8
  • VIP ⭐️⭐️⭐️⭐️⭐️
  • 425 replies
  • May 10, 2024

I think that we all have been there… This shouldn't be considered an engagement request. 
How creating ideas left-and-right for these seemly small things is better than working through them and deliver a fix? 😔


romihache
Forum|alt.badge.img+8
  • VIP ⭐️⭐️⭐️⭐️⭐️
  • 425 replies
  • May 10, 2024

*Enhancement


Reply


Cookie policy

We use cookies to enhance and personalize your experience. If you accept you agree to our full cookie policy. Learn more about our cookies.

 
Cookie settings