
Hi There!
I need to build a dashboard that looks similar to this, reporting on Success Plans by CSM, Success Plan by Client Management Segment & Progress by CSM:
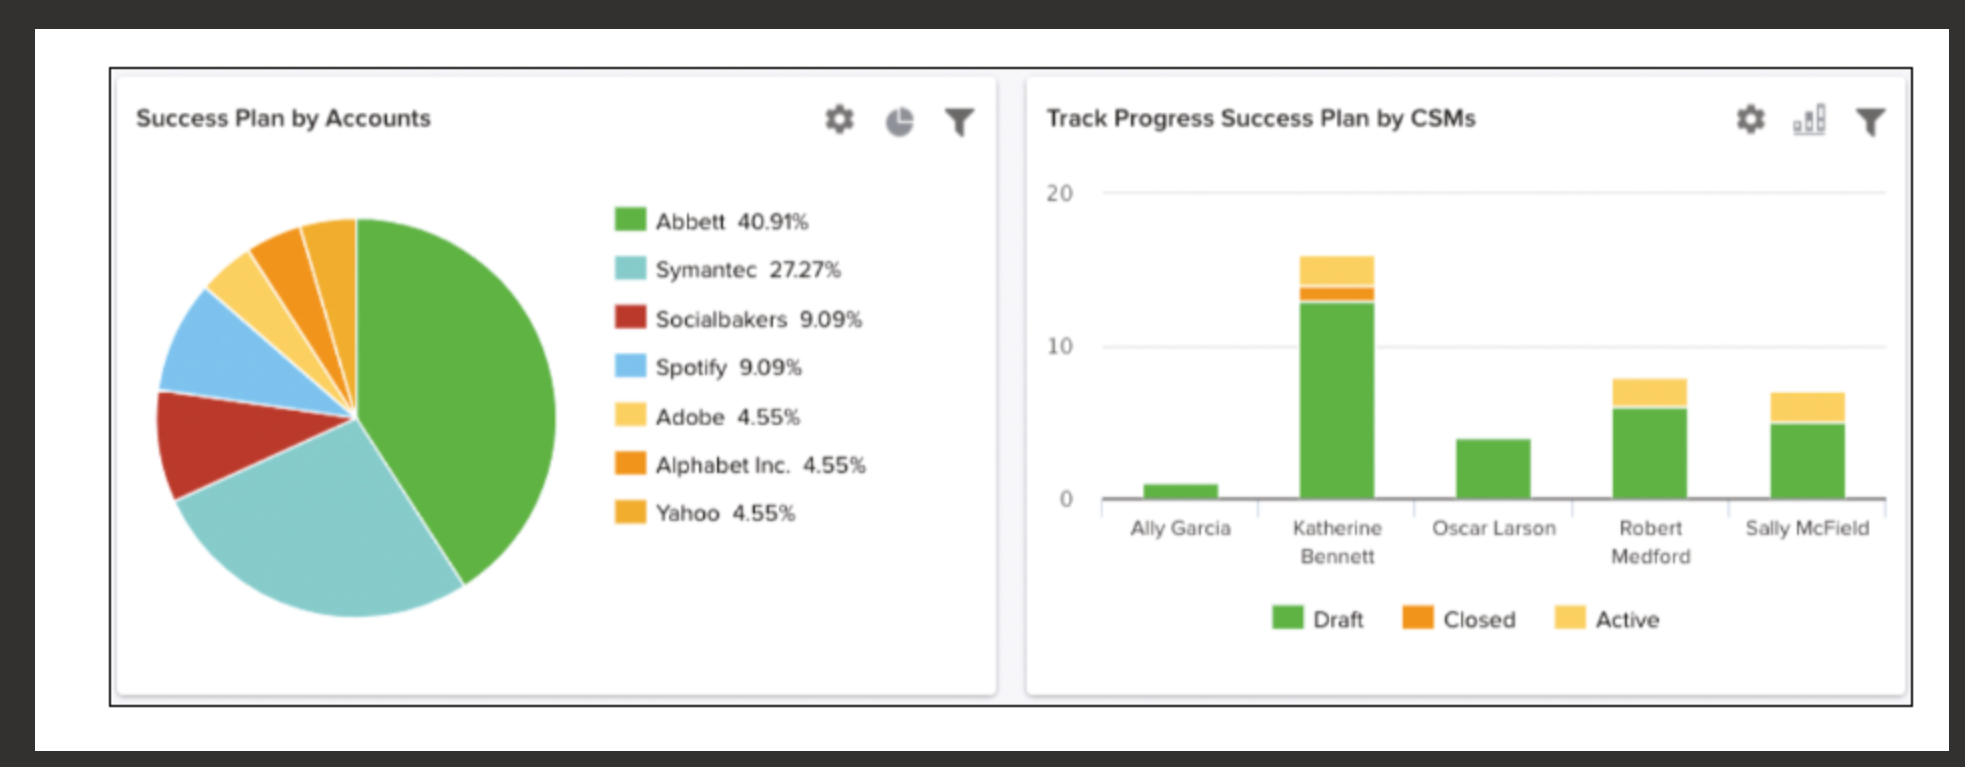
I have started by reporting on the Success Plan object, which has given me all the info except the Progress. I am not totally sure where that field would live…
Also, how would I then take that data and create the charts above?
Thank you!!!!
