This is a follow-up to my last post that contained FAQs on the CC+CS integration.
Once you’re ready to start building reports and dashboards with Community data in CS, where should you begin? Below I walk through the most important objects you’ll use and share some tips to help you get started.
Community {Name} User
This object has the name of the Community in it because if you had multiple Communities integrated with the same CS instance, there would be a User object for each Community.
This object contains your standard and custom user fields along with dates such as Registered On and Last Active At. It also includes a lookup to Company so you can pull in fields from that object.
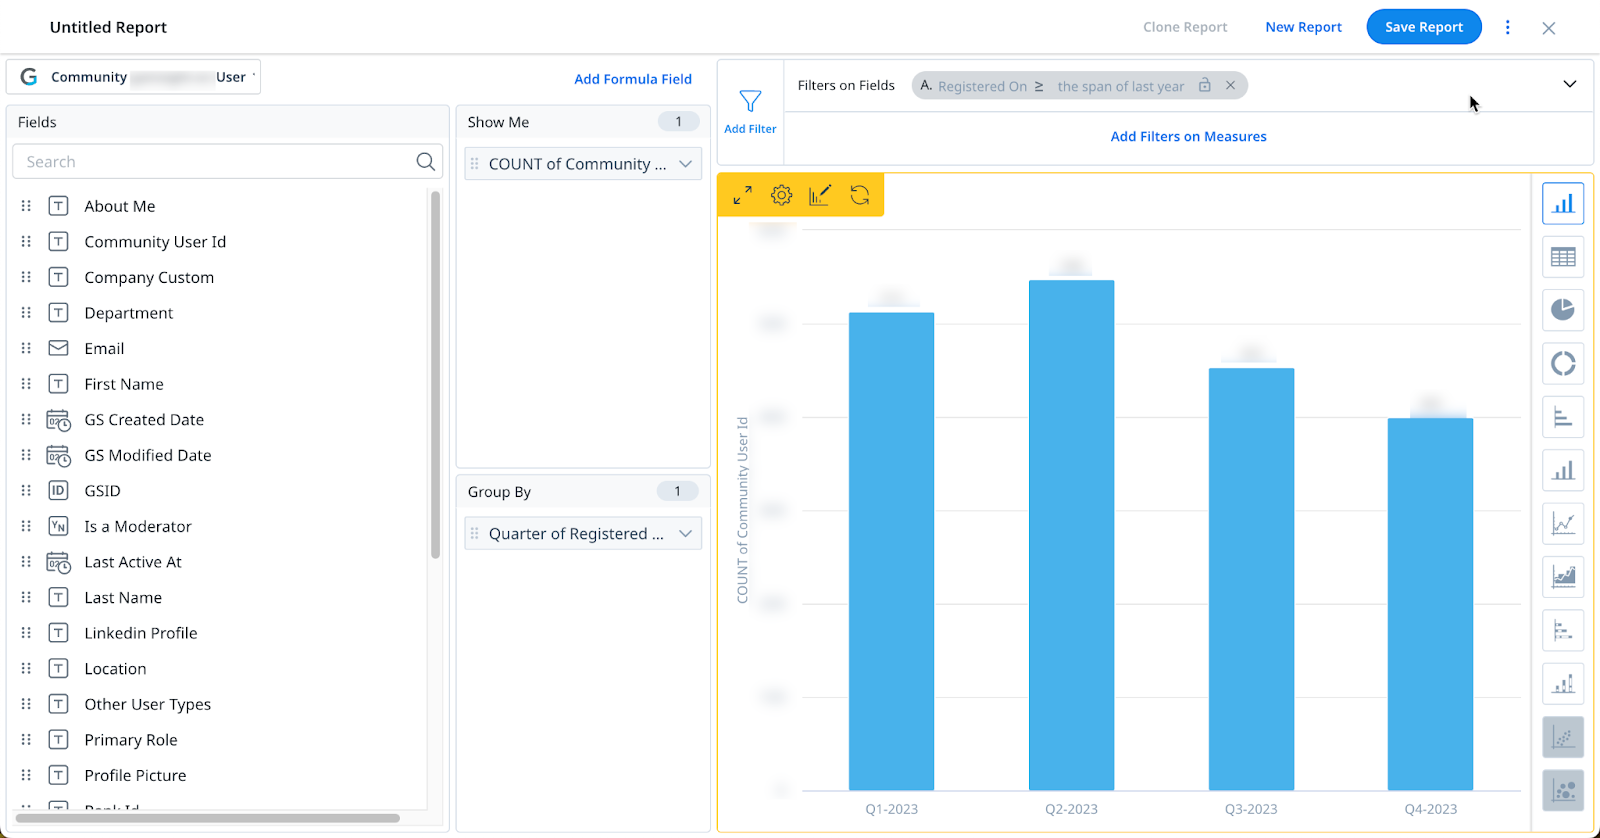
For this report I Grouped by registration date and Counted the number of Community Users. This shows me the registration trend in my Community.
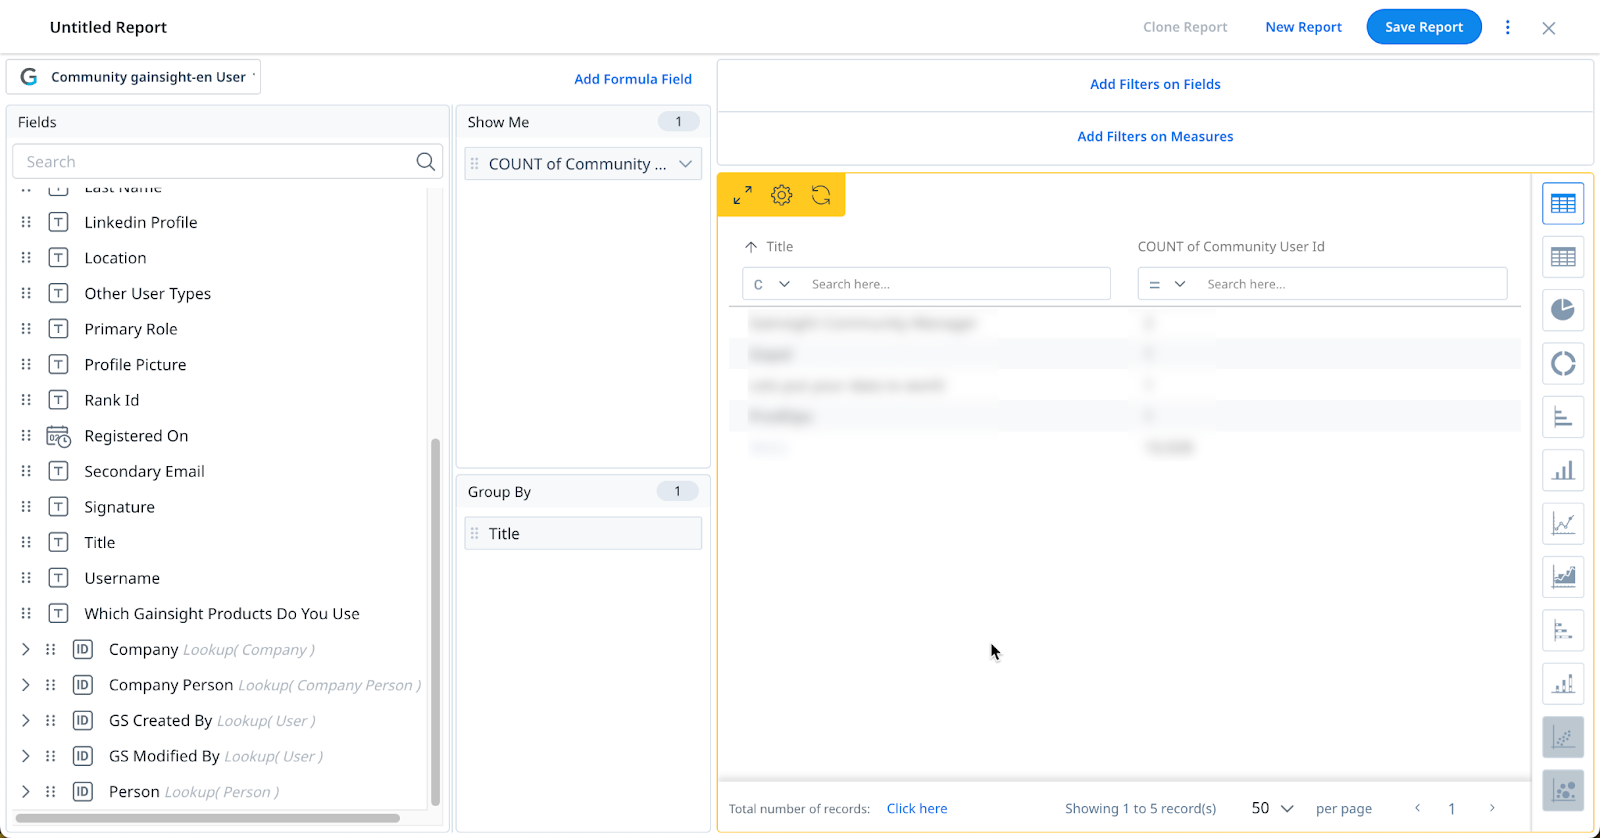
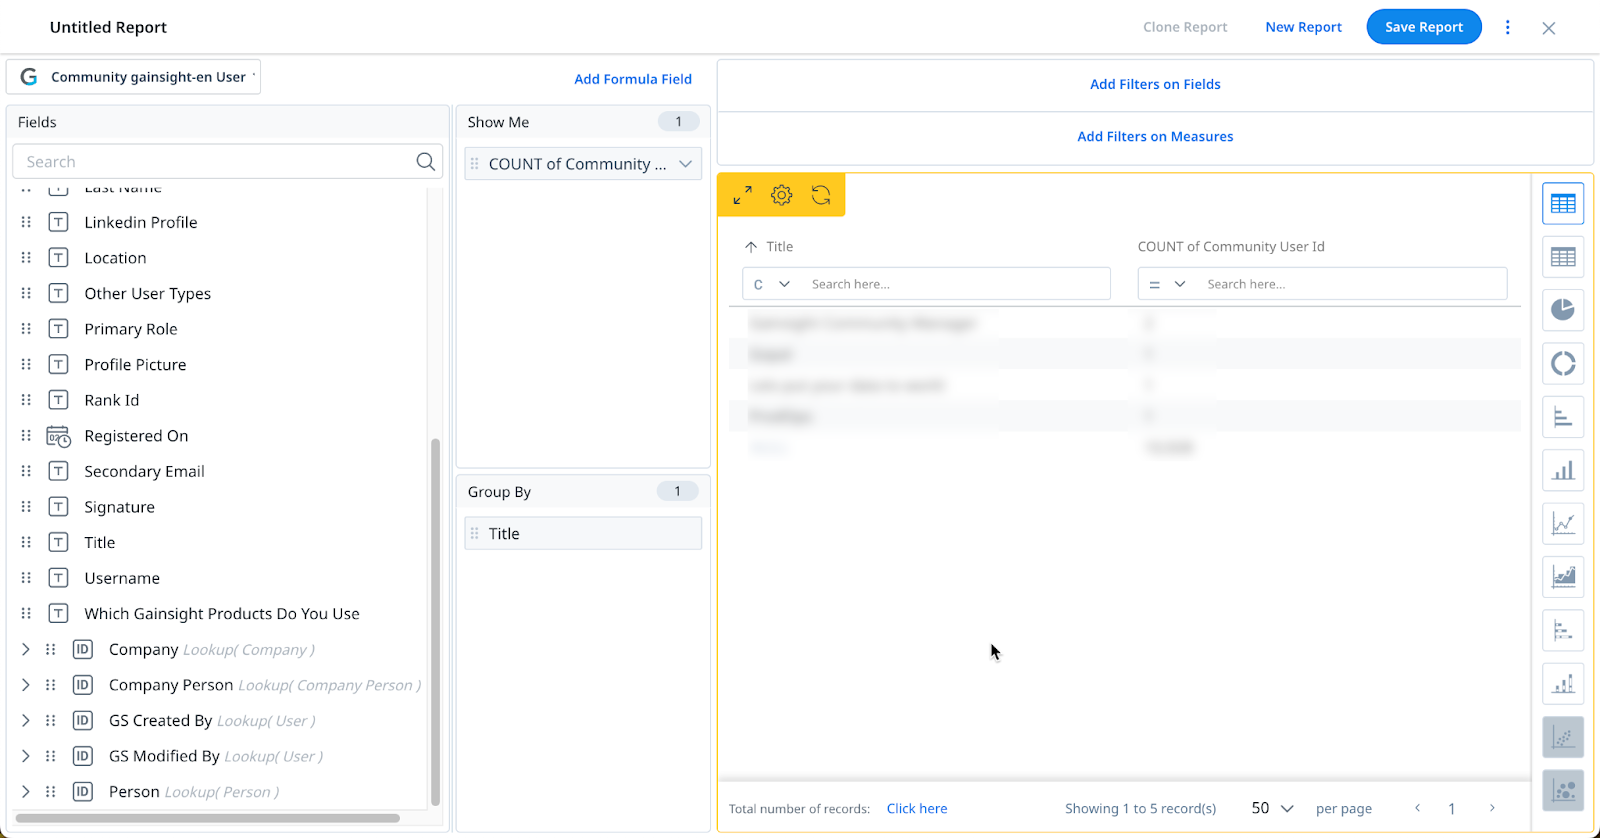
I could also Group by Title to see the most common Job Titles provided by my Community Users.
Community Activity
This object shows pages that are being Viewed within the Community. In the future additional types of activity will be shown in this object as well.
Here I’ve filtered by Community User ID is null, which shows users who were not logged in when they viewed the page. I’ve Grouped by SEO Url so I can see which pages are being anonymously viewed the most. This gives me clues about which pages are bringing people to Community.
The Resolve icon allows me to set up a lookup to the Community {Name} User object.

Now I can bring in Community User fields. This feature can be used on any object where that icon appears.
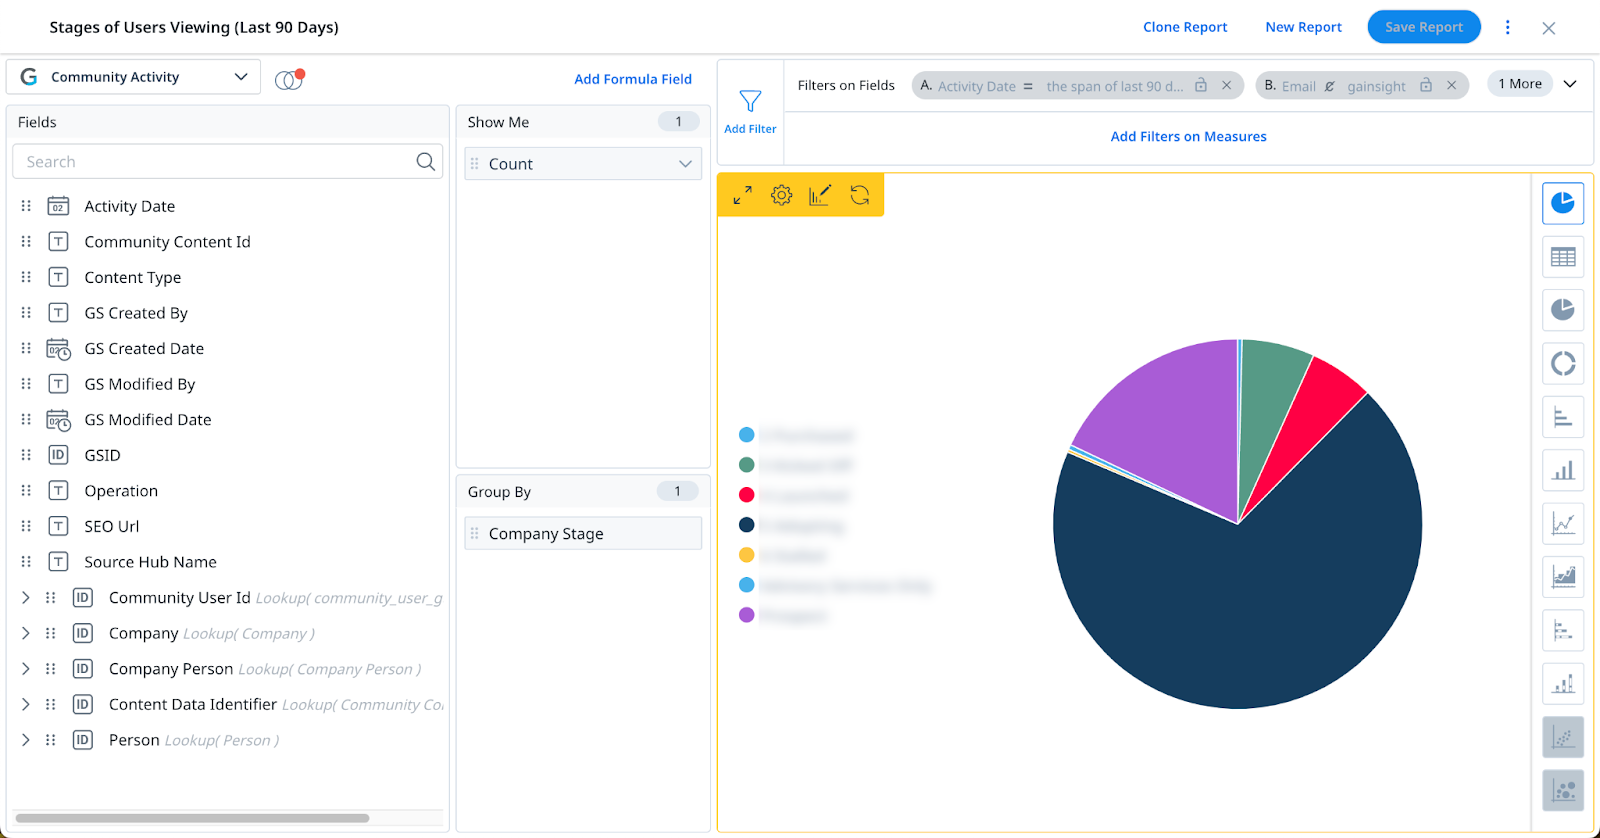
I created a report that shows the Count of page views Grouped by Stage of the Company. Now I can see which types of clients are viewing the most content within my Community.
Community Content
This object shows the Topics that have been posted as well as Replies. It also shows the Categories of Community content.
- The Content Type field shows whether the row is for the Topic itself, a Reply on a topic, or a content Category.
- The Content SubType field shows whether a Topic is an Idea, Question, Article, etc.
- The Subject shows the title of the Topic, whether the record is for the original post or a reply.
- The Author Id can look up to Community User (via the Resolve icon as described above) and shows who authored the topic or reply as designated by the Content Type.
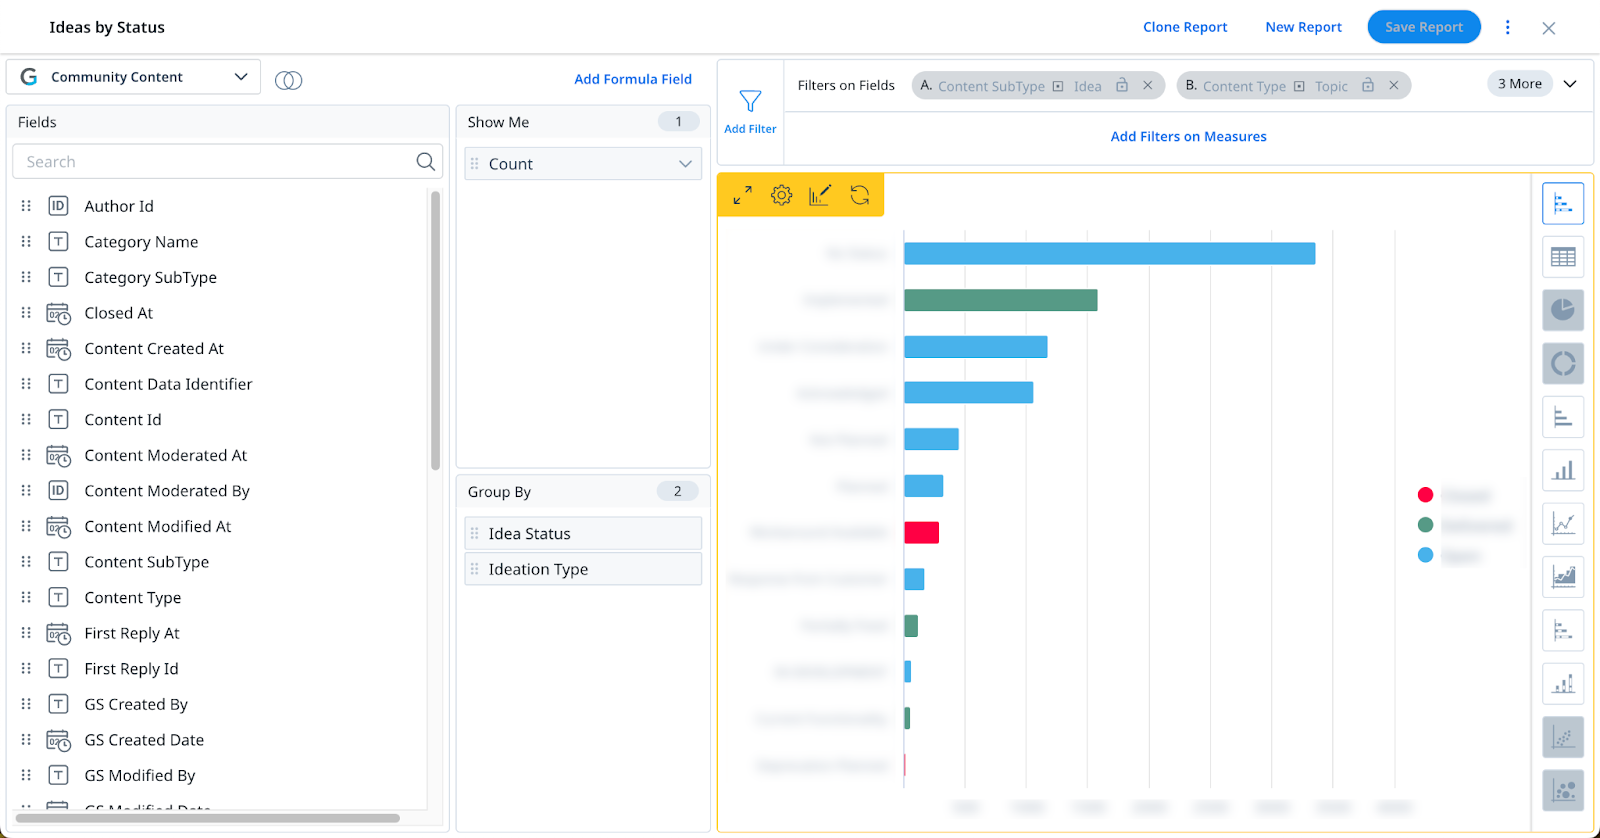
By Grouping by the Idea Status and Ideation Type, I can see a chart of the Count of Ideas with each Idea Status, color coded according to the Ideation Type. Ideation Type is Closed, Open, etc whereas Idea Status is Under Consideration, Planned, Implemented, etc. This helps me see how we are using the Ideas submitted to the Community.
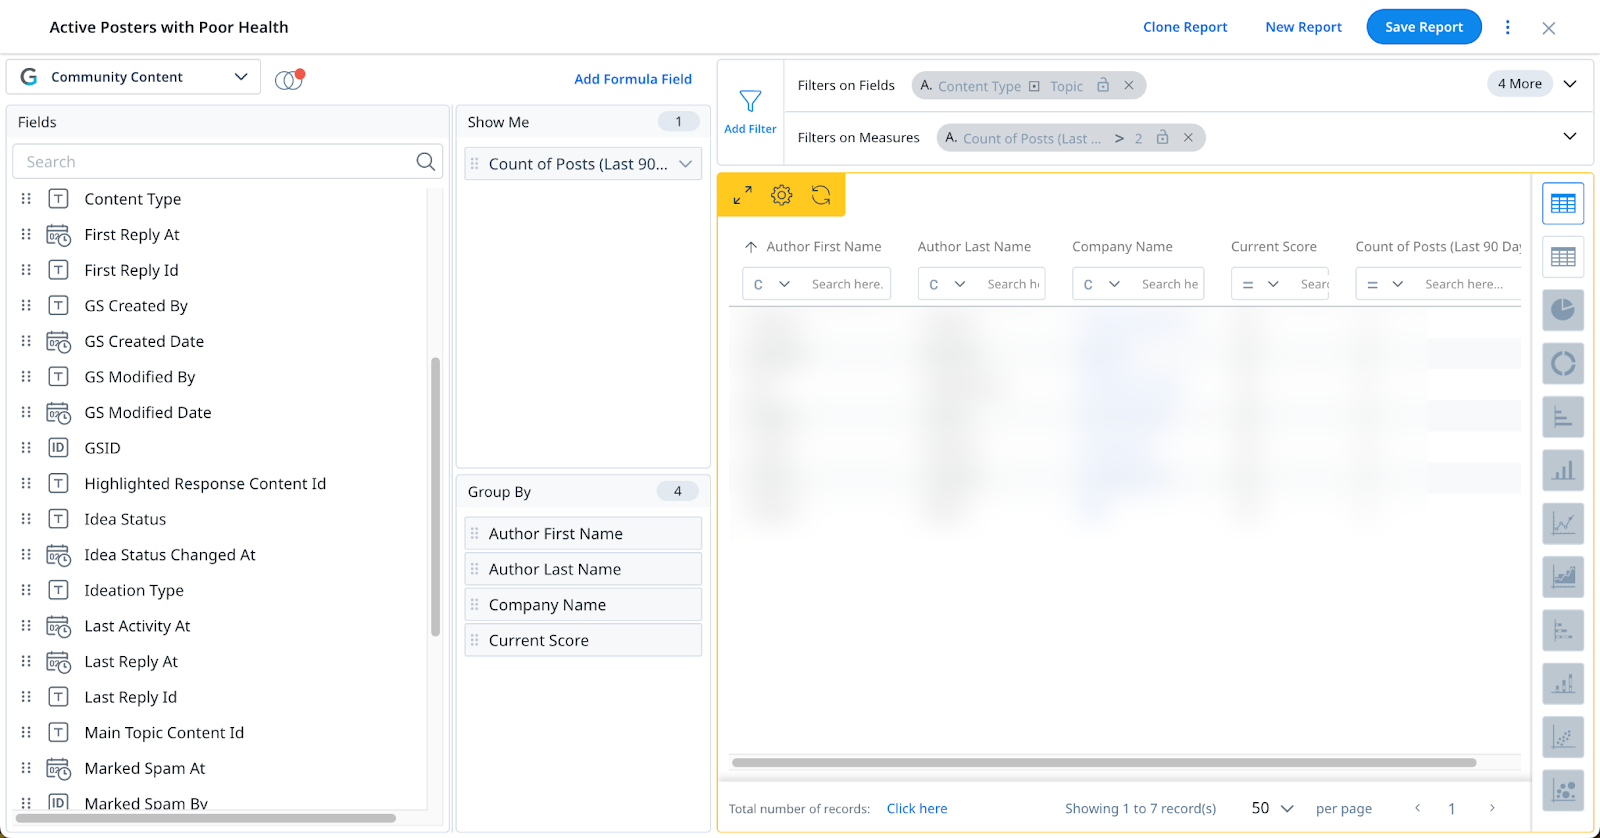
Below I have Grouped by User, Company, and Company Health Score and Counted the number of posts. Then I filtered for poor Health Scores and a high number of recent posts. This shows me users who are very active in the Community and associated with an unhealthy customer. I may want to review their posts to ensure they are getting the answers they need, and follow up outside of Community if it looks like they could benefit from extra support.
Community Trend
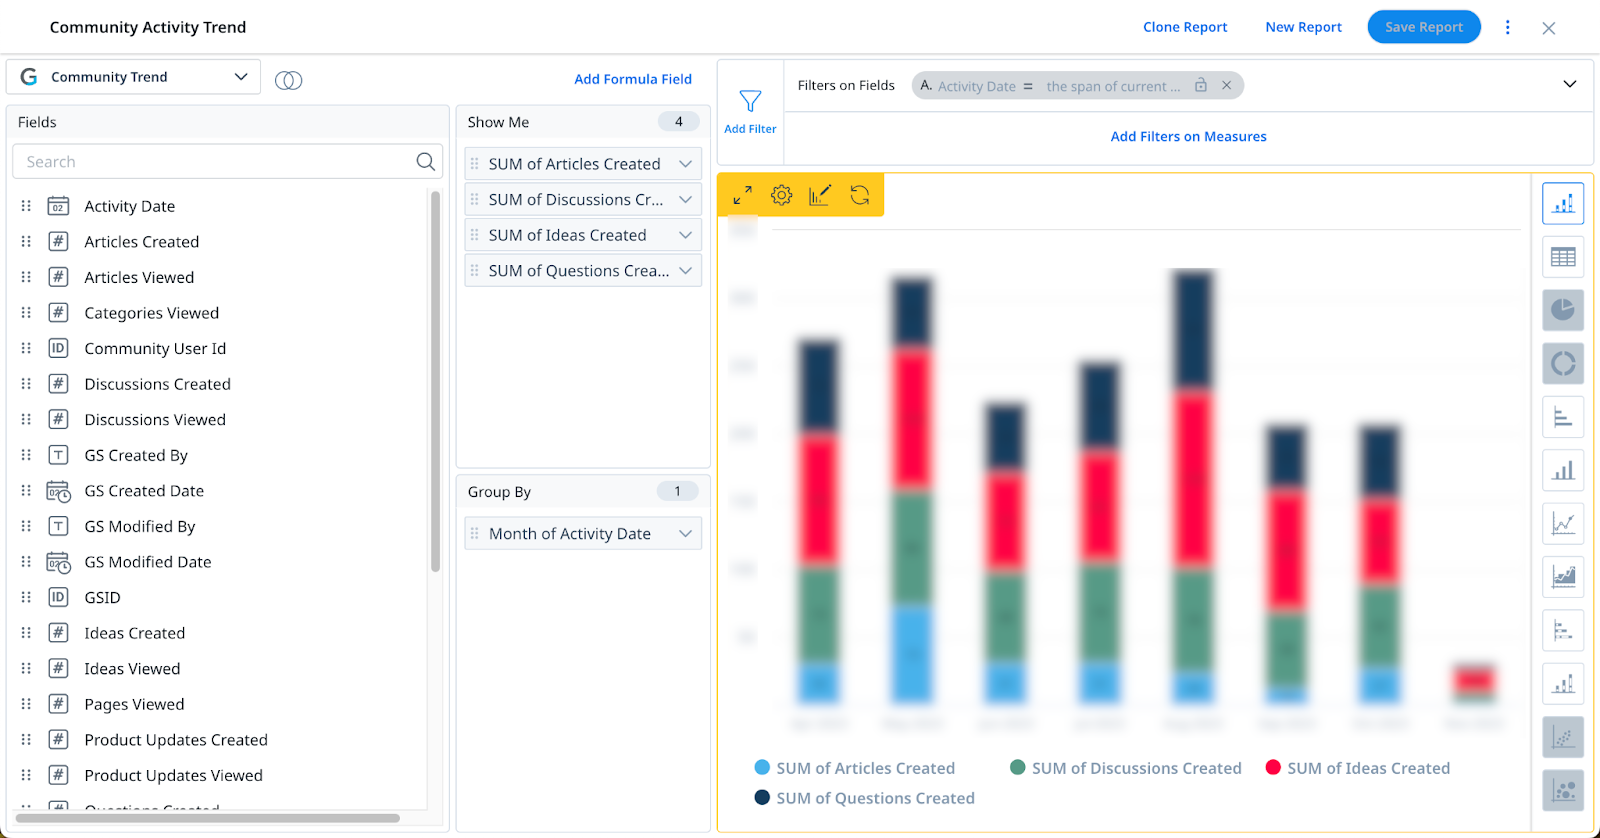
This object has aggregated counts of different content types. It can be useful to see trends over time.
To look at this data, I created a stacked column chart that is grouped by the Month of Activity Date. I selected a few types of content that I wanted to see, and now I can review all of this data at once to see trends.
I hope this has given you confidence and sparked some ideas for building reports in CS with CC data! Next I’ll be posting some best practices in regards to reports for the key personas interested in this data: CSMs, Community Managers, and Executives.
You can find more details on these objects in our help documentation: https://support.gainsight.com/Gainsight_NXT/Administration_and_Permissions/General_Administration/Gainsight_Object_Glossary#Community_Objects
