I know that there is a desire for easier reporting on Cheat Sheet usage data, and I agree that it would be nice to have this data in Report Builder, perhaps in the GS Asset Usage Tracking object.
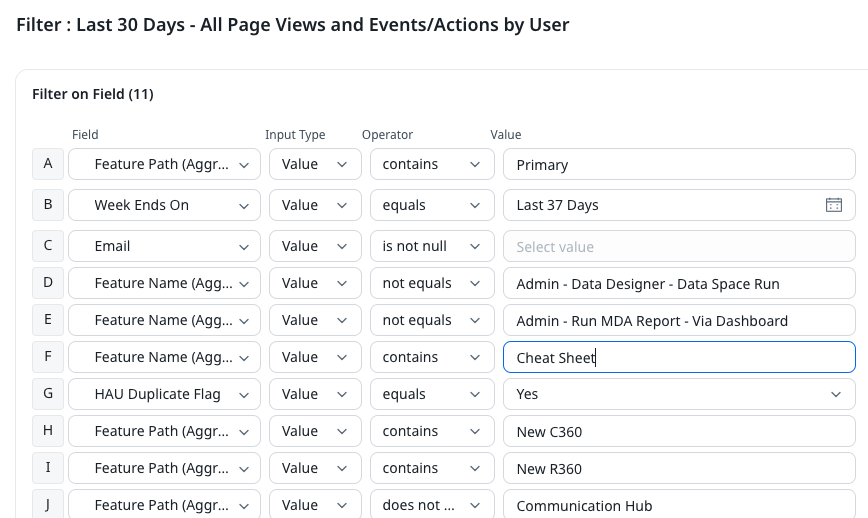
In the meantime, however, I did want to share how we are reporting on Cheat Sheet (note: this only applies if you have access to Gainsight’s Administration tab.) If you go to your Administration > General > Gainsight360, you’ll see two different relevant reports: Overall Usage Page Views Events and Feature Usage. In both of these you can access the filters and manually change one to include “contains Cheat Sheet.” Here’s how the filter looks for the Overall Usage Page Views Events tabular report. I changed Filter F, and from here can download the data and manipulate it via Excel.
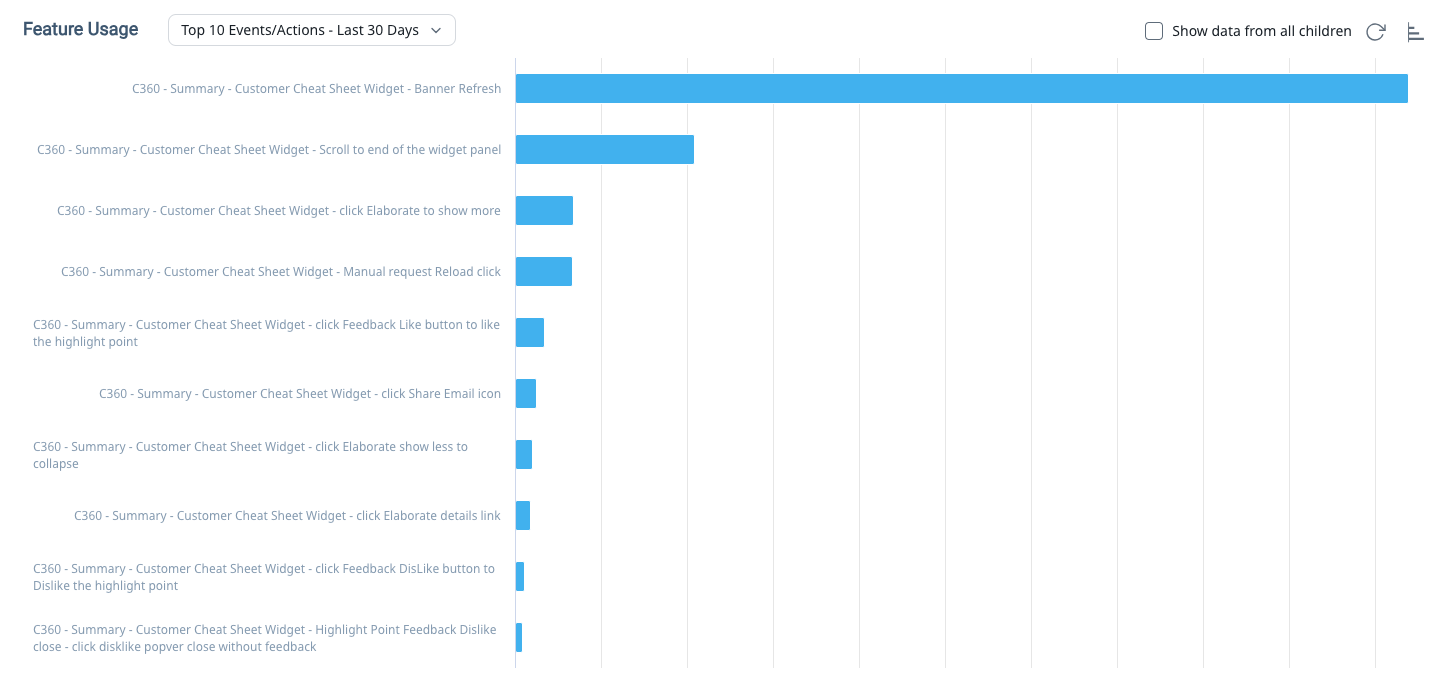
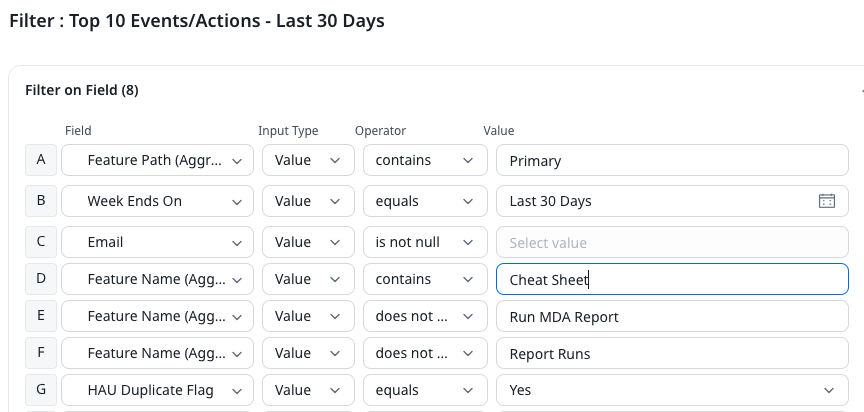
As for the Feature Usage report, this is a report that shows count of actions by feature. The individual Cheat Sheet actions Gainsight tracks are actually pretty detailed and clearly labeled in my opinion, so I found this quite useful. Again, since we cannot actually add filters, I simply changed Filter D to include “contains” Cheat Sheet.
The report is set as a pie chart, but I found that changing it to a bar chart is better because you can more easily see the individual events, whereas the legend in the pie chart cuts off the legend and requires a bunch of scrolling. Here’s what it looks like. Hopefully this helps!
