
Ever feel like you’re drowning in a sea of support tickets?

We’ve all been there! That’s where rolling averages come to the rescue. Imagine having a lifeboat that smooths out the chaos, letting you see the bigger picture of your customers' needs. By tracking the rolling average of support tickets per customer, you get a clear, steady view of how things are really going. This metric helps you spot trends, catch potential problems before they explode, and make sure your team’s time and energy are used wisely.
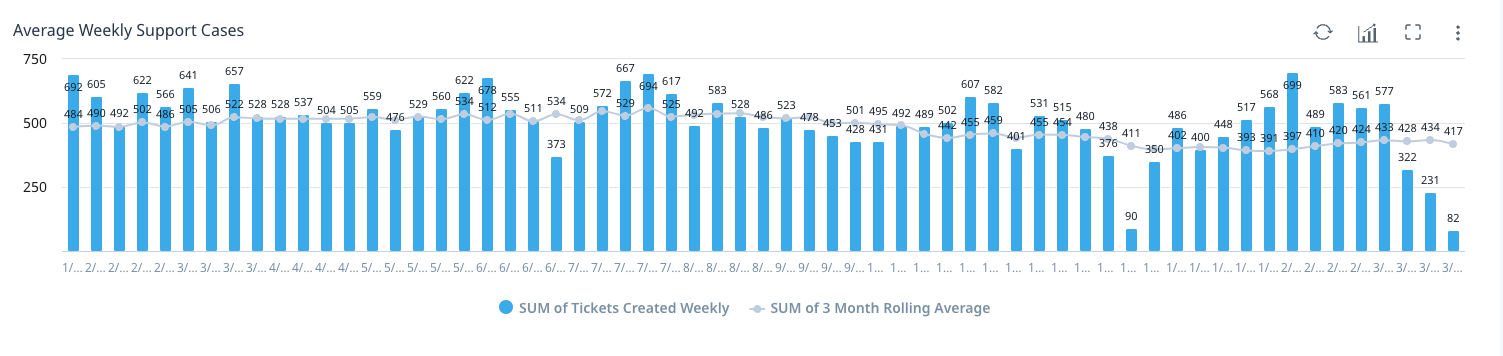
But how do you know what is a good vs bad number of tickets or type of cases to be entered? A large number of support tickets can indicate an uneducated or dissatisfied customer. Conversely, no support tickets can be indicative of an unengaged or at-risk customer. At Gainsight, we look at each customer’s rolling 90 day average of tickets and then compare weekly trends against that average to look for spikes or declines. In this way, we are measuring each customer’s number of support tickets against themselves to give us a much more accurate indicator of health, risk, and opportunity than a one size fits all approach.
See the steps below to find out how to configure a rolling 90 average of support cases metric for your organization:
- Bring raw support data into Gainsight using one of the out of the box Support Connectors
- Create an aggregate table in the MDA to calculate averages
- Filter the data down to 30 days and create averages daily per customer
- Configure a rule that takes the current number of support tickets and load it the same aggregate table
- Use a formula field (OPEN - AVERAGE). If the output is zero or a negative number, the number of support tickets is average or below average, while a positive number indicates an above average number of support tickets compared to the rolling 90 day average.
💡 How does your organization configure support metrics to aid Customer Success goals? Drop some inspiration below 👇