

Guide to the Self-Service Dashboard
Currently the self-service dashboard only supports tickets where Zendesk is the source.
Let us know in the replies if you use another Helpdesk and would also like to report on your self-service performance with this dashboard.
The self-service dashboard shows the proportion of your customers that are able to help themselves with help content, without having to talk to your support team via a ticket.
With this dashboard, you can see whether you’re enabling greater self-sufficiency amongst your customer base, or whether customers are still spending a lot of time dealing with the back-and-forth of support.
Value metric: Self-service score
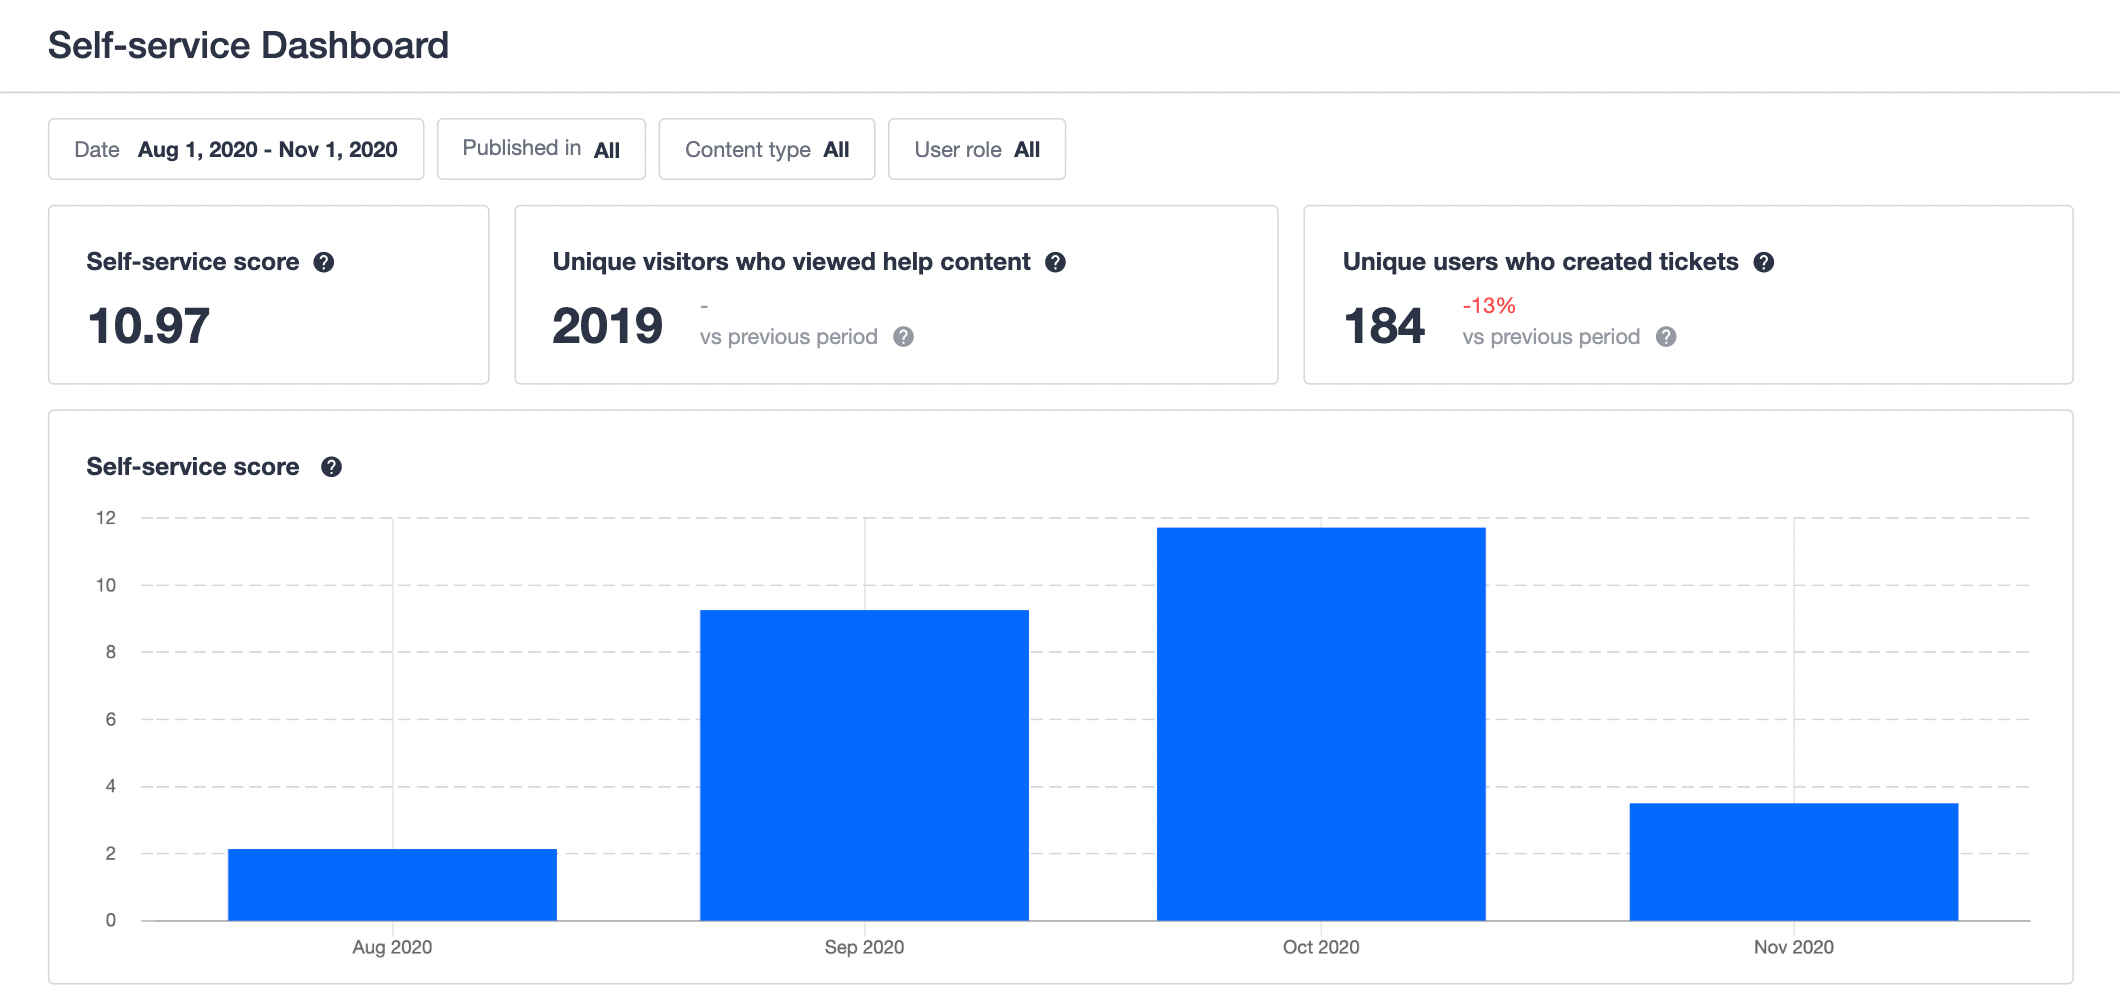
The value metric for the self-service dashboard is self-service score. We believe that this metric is a leading indicator for NPS (users can solve problems quickly, without having to wait for a support agent). Plus, you’ll save on the time that your support team needs to spend on one-to-many issues, giving them the space to help customers with 1-1 problems that need human intervention and to support customers on a more tactical level.
The calculation is: Total unique visitors who viewed help content / Total unique users who created tickets. A good self-service score depends on your industry (for instance, B2B companies tend to have a higher self-service score than B2C companies) - see this article by Zendesk to go deeper on this.
Metric reference: Self-service dashboard
This table explains in detail how each metric shown on the self-service dashboard behaves, and any limitations or behaviours to watch out for.
| Metric | Description | Extra Details |
| Self-service score | The ratio of unique visitors who viewed help content to unique users who created a ticket in the selected time period. | Calculation: count of unique users who viewed self-service content / count of unique users who submitted support tickets. Ticket data is imported via your external helpdesk software. |
| Unique visitors who viewed help content | The number of unique visitors who viewed an article, question with a best answer, or a conversation on the community in the selected time period. | Page views on topics that have been trashed/marked as spam not considered when calculating unique visitors. We make an assumption that conversations/articles are more likely to help users than a question without a best answer marked. However, when a question has a best answer marked, then all views on that question are counted, even those before the answer was marked. Both logged-in and anonymous visitors are included. Visits from different devices are counted as separate, unique visitors. Page views from bots are automatically excluded when calculating unique visitors. |
| Unique visitors who viewed help content % change | The percentage difference between the number of unique visitors who viewed help content in the current/previous time period. | - |
| Unique users who created tickets | The number of unique users who created a support ticket in the selected time period. | Ticket data is imported via your external helpdesk software. |
| Unique users who created tickets % change | The percentage difference between the number of unique visitors who created tickets in the current/previous time period. | - |
| Self-service and helpdesk user trends | Unique visitors who viewed help content and unique users who created tickets over time, shown on a daily interval. |
Filters
Use the following filters to adjust how the ‘unique visitors who viewed help content’ metric is calculated (and therefore your self-service score).
- Published in: choose which categories and/or groups should be included when calculating unique visitors.
- Content type: choose which content types should be included when calculating unique visitors (available options: article, answered question, conversation).
- User role: choose which primary or custom user roles should be included when calculating unique visitors.