This article outlines the steps to effectively start your data analysis journey, emphasizing the importance of user segmentation based on various attributes.
Overview
Analyzing data in the Gainsight Customer Communities (CC) data lake can provide valuable insights regarding user behavior, engagement, and overall community performance.
The CC data lake employs a dimensional data model, which organizes data into structured formats that facilitate reporting and analysis. The ultimate goal of this modeling approach is to categorize data into fact and dimension models, which serve as key components for understanding and analyzing business metrics within the platform.
What are these components?
- Facts - In the CC Data Lake, a fact represents a collection of quantitative information that typically refers to actions, events, or process results. Facts are often likened to verbs, as they capture measurable outcomes. Examples of facts relevant to the platform might include account creations, posts created, questions replied, or emails sent. Fact tables in the CC Data Lake serve as historical records of these actions; therefore, when updates are necessary, new data is added as additional rows instead of overwriting existing entries. Data within these fact tables is updated regularly, with refreshes occurring every 4 hours to ensure that insights remain timely and relevant for users.
- Dimensions - In the CC data lake, dimensions contain qualitative data that provides context to the facts by describing who or what performed or was affected by the action. Dimensions are commonly referred to as nouns, as they help to contextualize the events stored in fact tables. Examples of dimensions in this environment include users, events, topics, and replies. It’s crucial to recognize that a single noun can relate to multiple actions without creating duplicates. Consequently, when updating dimension tables, the existing data is overwritten rather than duplicated, following the principles of dimensional modeling. Similar to facts, dimension data is also refreshed every 4 hours, ensuring that the context for analyzing user actions remains accurate and up-to-date.
By applying these foundational concepts of dimensional data modeling, the CC Data Lake enables users to uncover insights that drive strategic decision-making and enhance user engagement.
Analyze Data in CC Data Lake
To analyze the data available in the CC data lake:
Define Objectives
Before diving into data analysis, clarify the objectives of your analysis. Consider what you want to achieve—understanding user engagement, identifying behavior trends, or evaluating content performance. Clear goals will guide your analysis and ensure you extract actionable insights.
Access the CC Data Lake
To start analyzing data, ensure you have access to the CC Data Lake. Use one of CC integration Apps to connect Power BI, Looker, or Tableau to Data Lake.
Understand User Attributes for Segmentation
Segmentation allows you to break down your user base into distinct groups, making it easier to analyze specific trends. Consider segments based on:
- User Roles
- Companies
- Badges
- Ranks
Prepare the User Data
To prepare your data for analysis, follow these steps to create a comprehensive dataset through structured left outer joins.
-
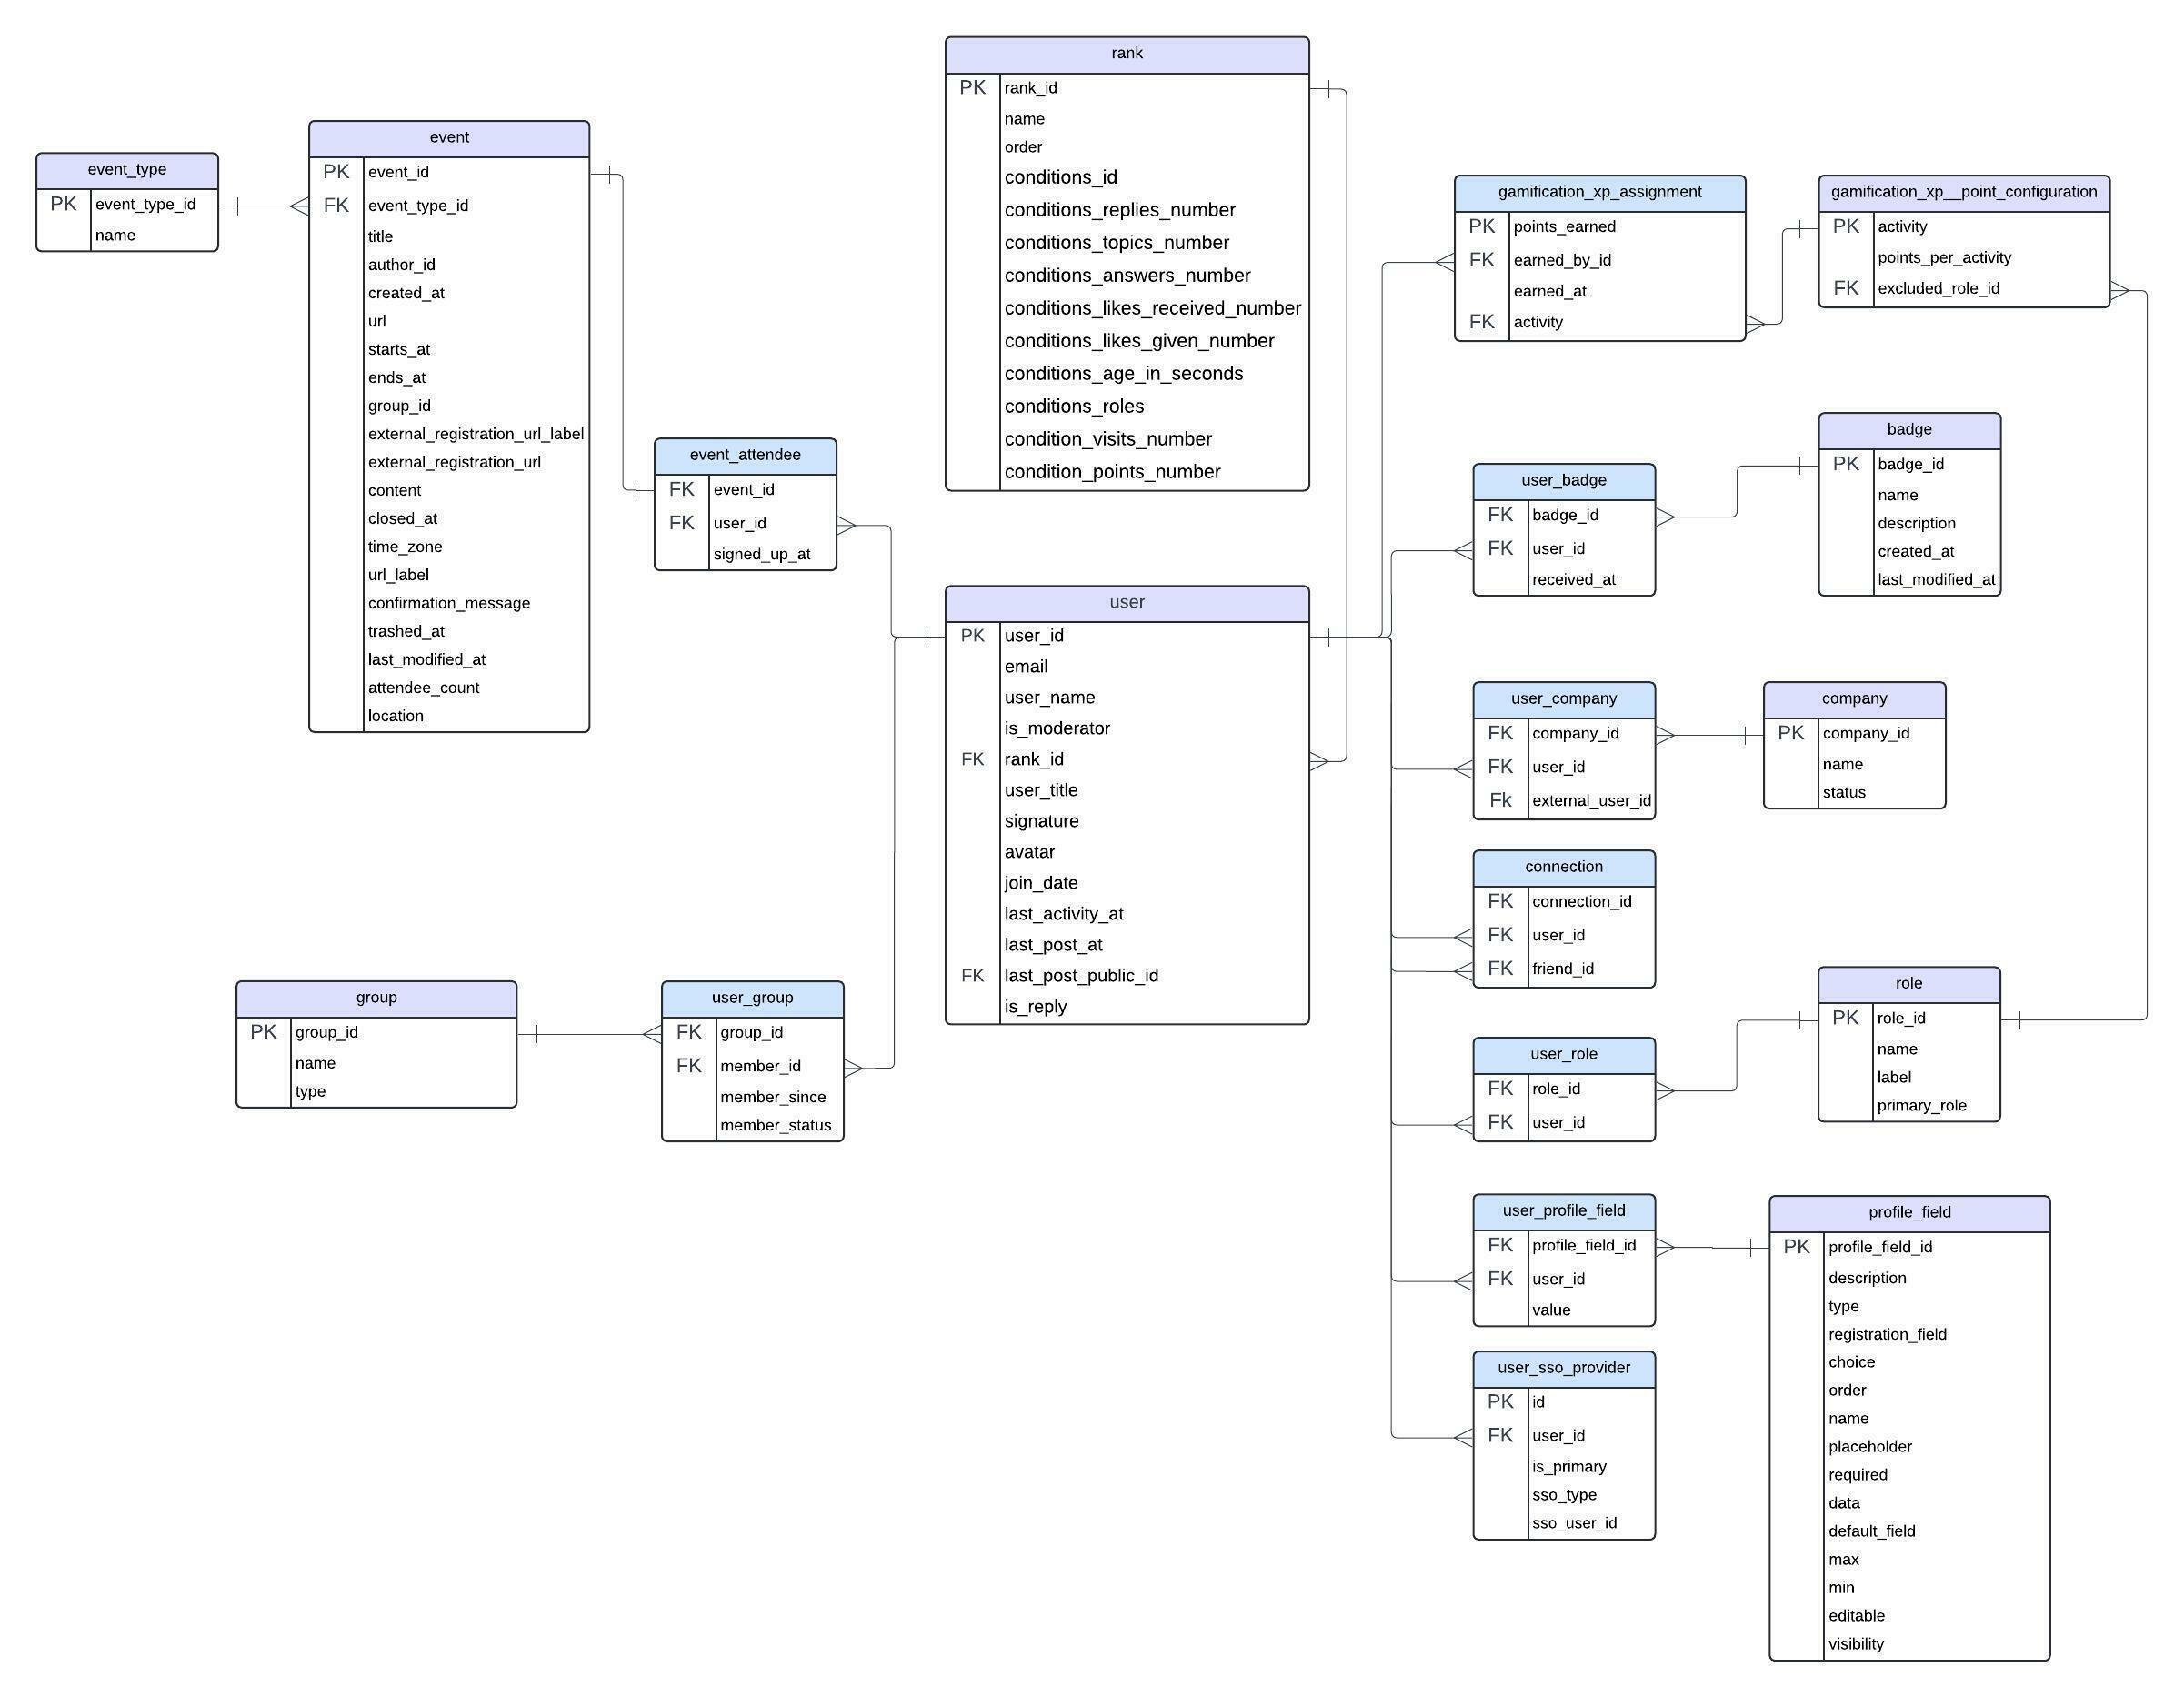
Join with Intermediary User Objects - Start by joining the User dimension with intermediary tables such as user_role, user_company, and user_badge or user_group using user_id. This captures all users, even those without specific roles or badges.
-
Join with Attribute Tables - Connect the intermediary tables to their respective attribute tables: use role_id to join with the Role dimension table, company_id with the company dimension table, and badge_id with the badge dimension table or group_id with the group dimension table. This enriches your USER dataset with detailed attribute information.

-
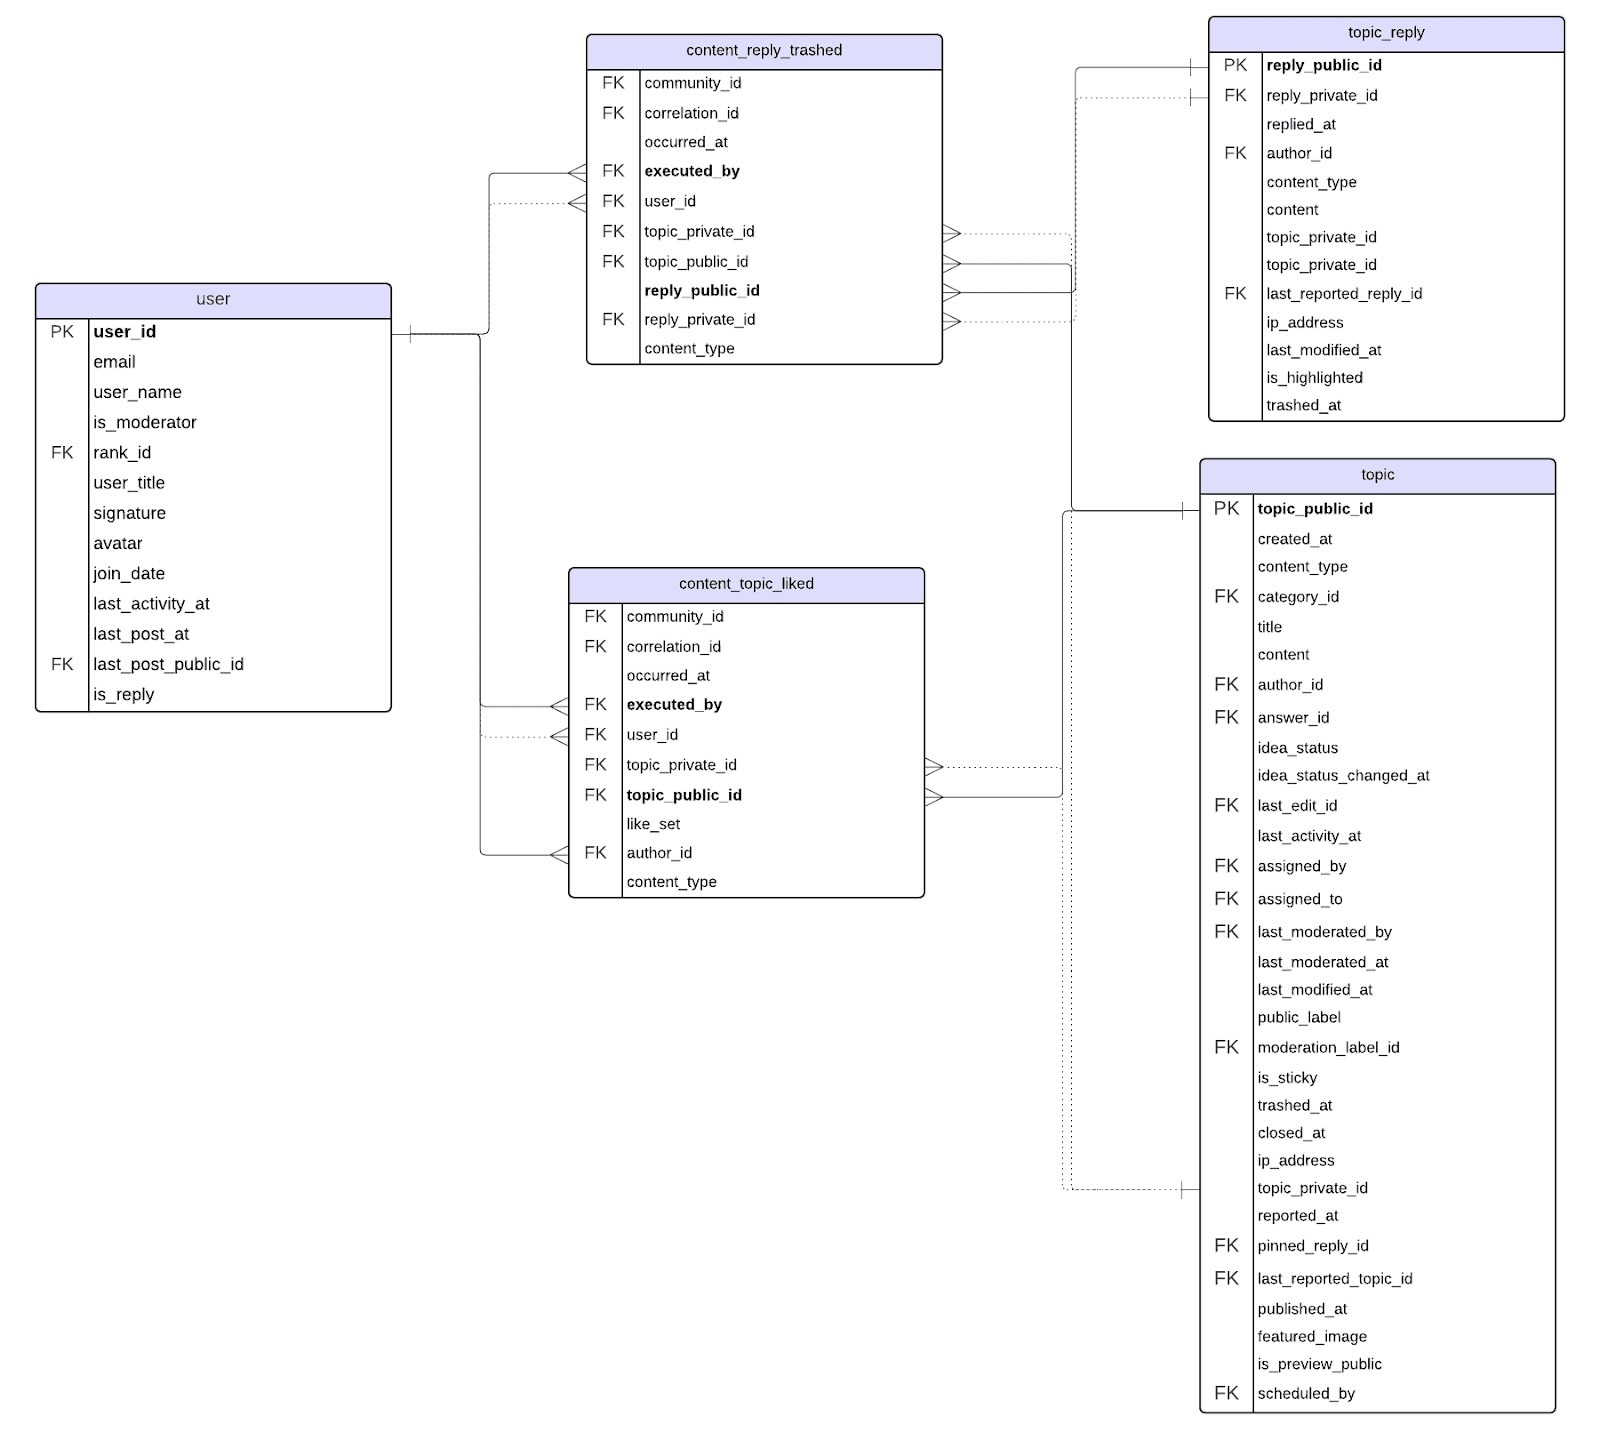
Join with User Tables with Facts - Now that you have a comprehensive User Object with all necessary attributes, you can join it with fact data in the CC Data Lake. Use the user_id from the User Dimension Object and executed_by in the facts to connect user activities. This will help you analyze how different user segments interact with the platform.
Prepare Data About Community Content
To analyze Community Content effectively, you will prepare data based on the topic object. This involves creating a structured dataset through a series of left outer joins with various dimension objects.
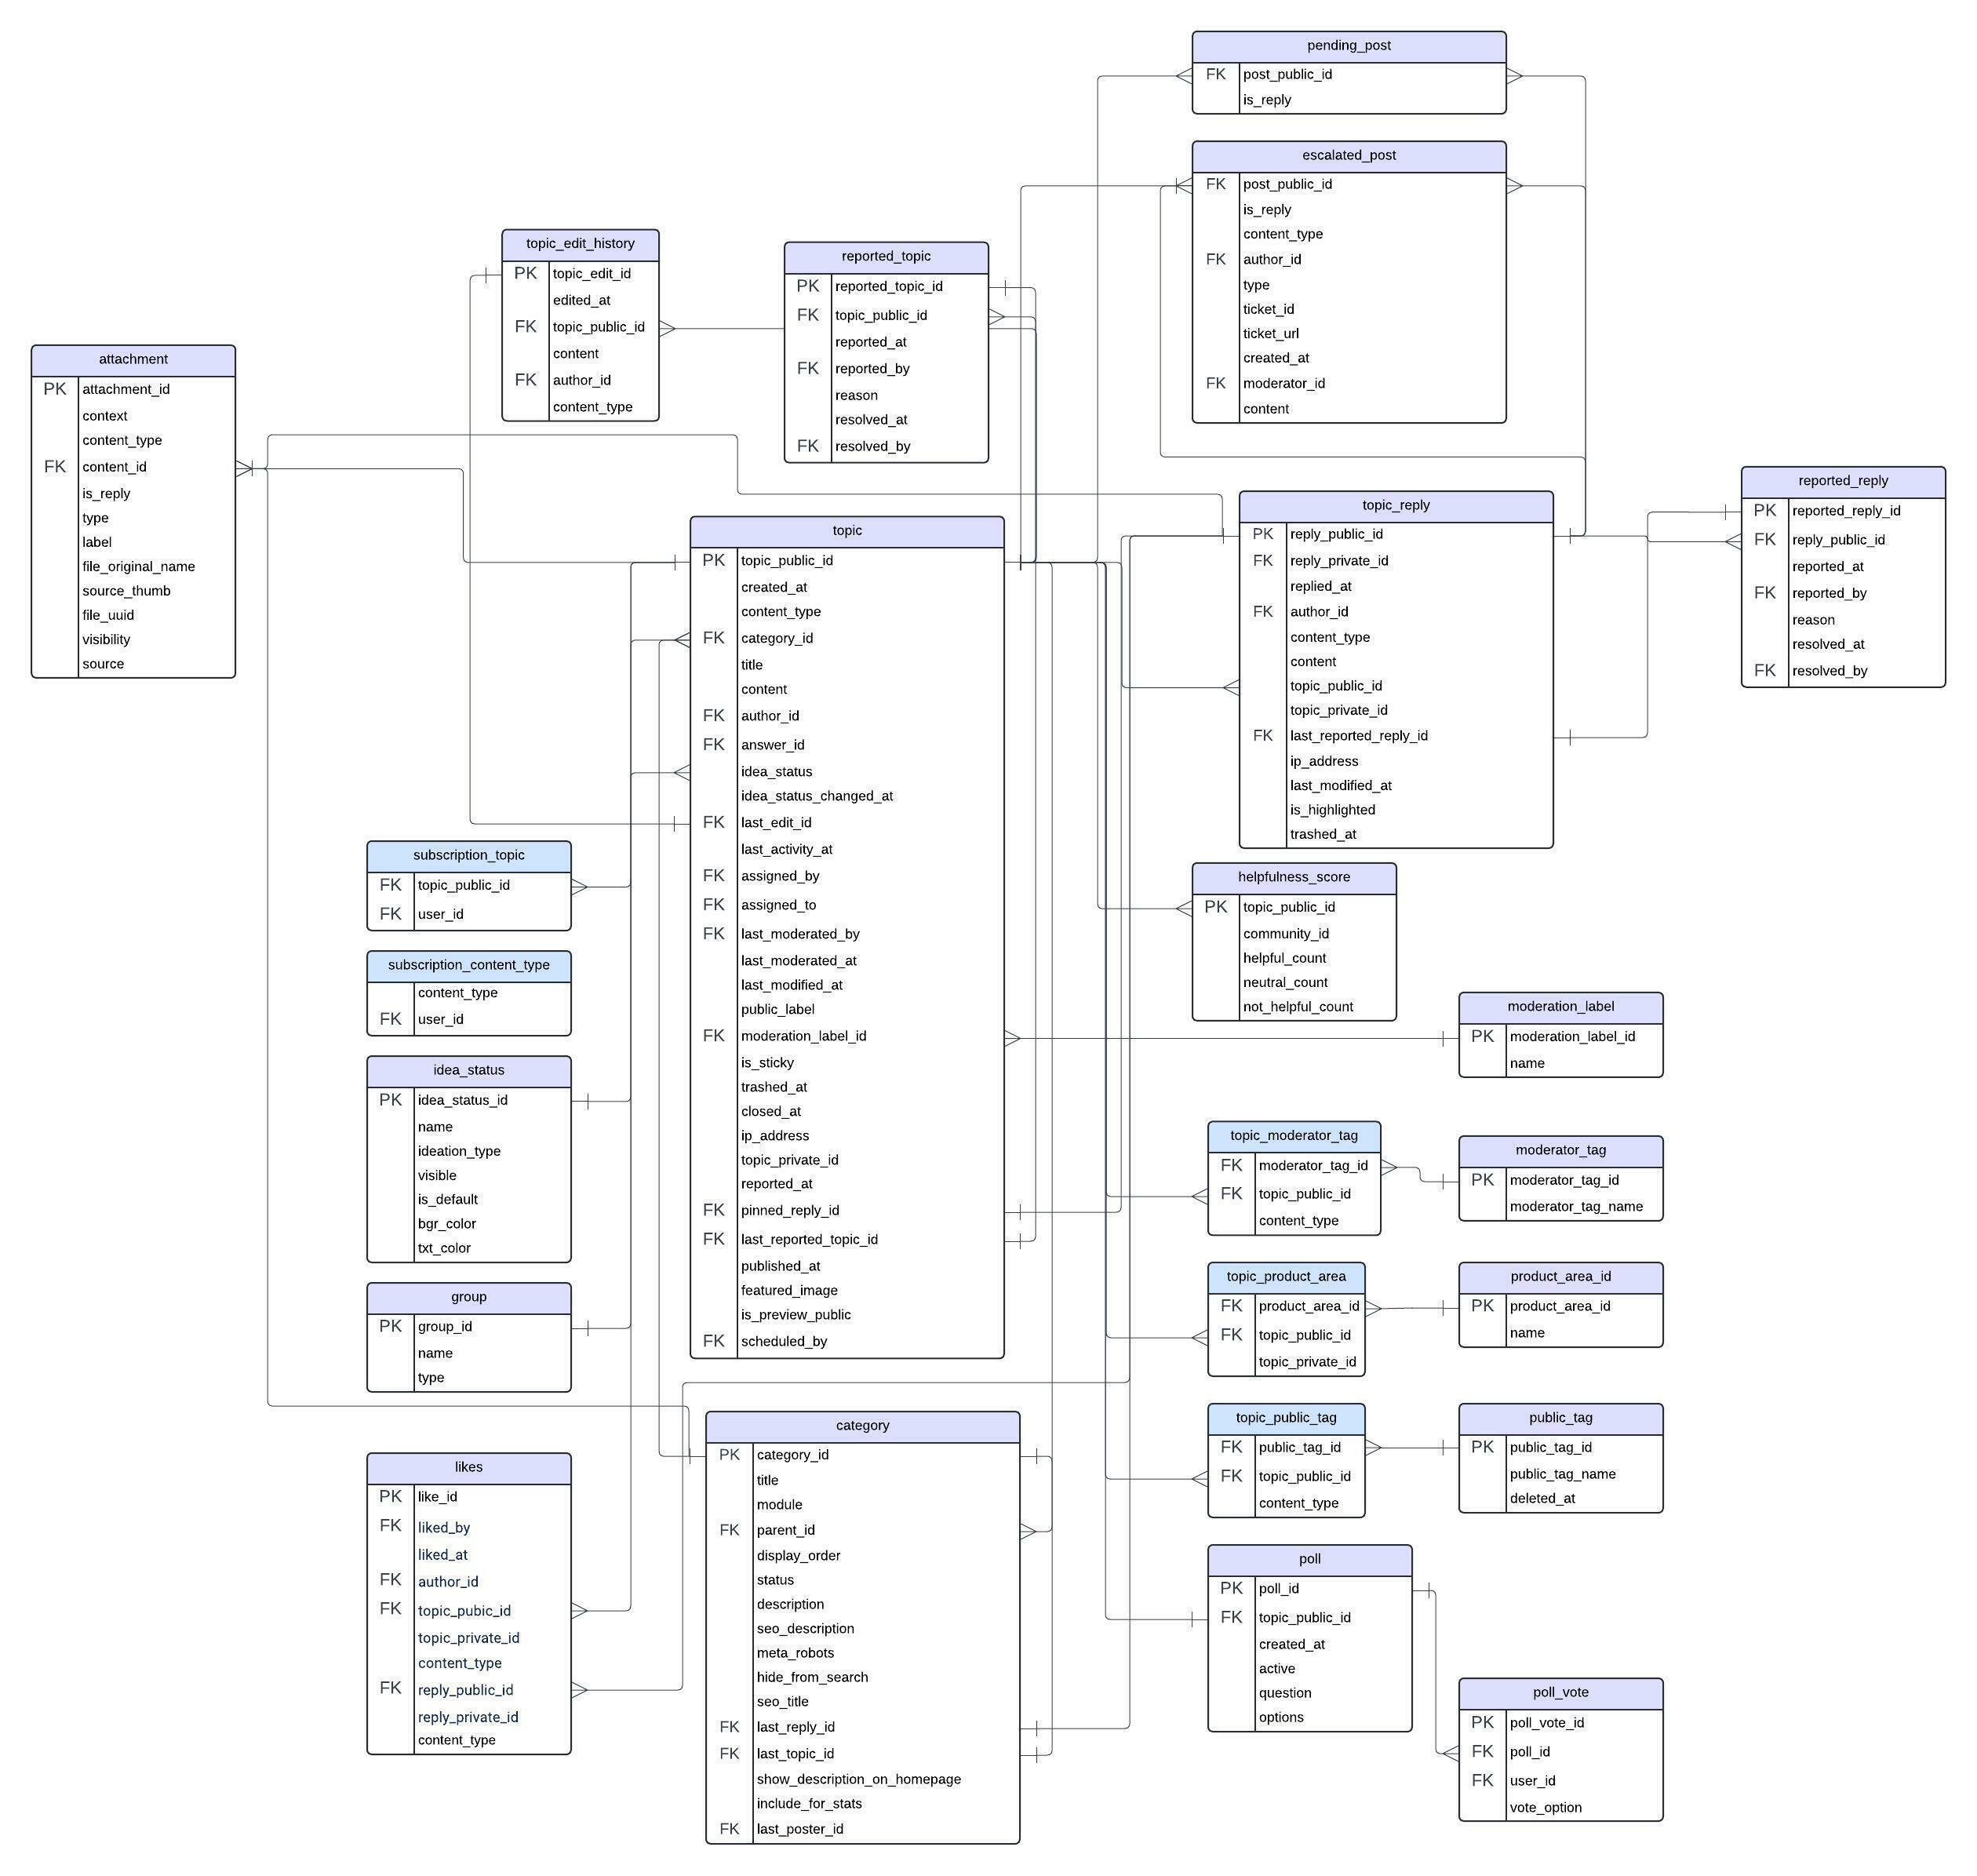
- Joining Directly with Single-Attribute Objects - For attributes that can have only one value per topic—such as category or idea_status —perform a left outer join directly with the respective attribute objects: category or idea_status. Use topic_public_id as the key to ensure accurate associations. You can also link topics with the related replies from the topic_reply table.
- Intermediate Joins for Additional Attributes - When a topic has multiple attributes of the same type, such as public tags, moderator tags, or product areas, a two-step join process is necessary to effectively capture these one-to-many relationships:
- Initial Join - Start by joining the Topic Object with the topic_public_tag, topic_product_area or topic_moderator_tag using topic_public_id as the key. This step ensures that all public and moderator tags as well as product areas associated with each topic are included, even when there are multiple entries.
- Final Join - Next, connect these intermediary results to the main attribute tables by performing left outer joins with the product_area, moderator_tag and/or public_tag objects using their respective IDs (moderator_tag_id, public_tag_id etc). This process guarantees that every tag is accurately linked to its corresponding topic.

- Join with Content-Related Facts - Once your content data is enriched with all necessary attributes, you can join it with any content-related fact from the data lake using topic_public_id or reply_public_id as the keys. This enables you to analyze user interactions with the community content more effectively.

If you have any queries or feedback, please drop an email to docs@gainsight.com or post a reply to this article.