There are several tools that can be used to gather data from your community: CC analytics tool, Google Analytics, Omniture, Coosto, Tracebuzz, Buzzcapture, and many more.


These tools can also be used to compare your community data to your other social channels and website. This document focuses on the process of how to create a report based on the CC analytics tooling and gives a brief description of data that can be derived from Google Analytics. If you work with other tooling, please consult your Community Consultant.


CC analytics tool


The CC analytics tool can be found in your control environment in the navigation on the left side of the page. On the Export page you’ll find a variety of downloadable exports. It is possible to get reports of the activity by exporting report files of a specific timeframe. There are 7 different exports:

  • Post
  • Topic
  • Private messages
  • User
  • Moderator action
  • Login
  • Mark as answer


NAME DESCRIPTION ANALYSIS EXAMPLES
Post export This export provides a list of all posts. A post is either a topic or a comment. 
  • Posts created per timeframe (weekly, monthly, quarterly)
  • Posts created per user (rank)
  • Posts created per category set or category
  • Most commented on topics (created in timeframe)
  • Most active users
Topic export Offers a list of all topics created.
  • Topics created per timeframe
  • Topics created per user(rank)
  • Topics created per category set/category
  • Created topics per type (question or discussion) per timeframe
  • Most viewed topics (created in timeframe)
  • Most commented on topics (created in timeframe)
  • Topics with a label
Private message export The private messages export provides an overview of all two way messages communication, but not the content from the conversation itself.
  • Private messages sent per timeframe
  • Amount of private messages sent or received by moderators (in timeframe)
User export Gives an overview of all user information from participants who have registered in this time range, including the amount of topics, comments, answers given, likes received and all filled in profile fields per user. 
  • Create an overview of the filled in profile fields (for email segmentation)
  • Create a database analysis
  • Create conversion rates to measure the activity of users
Moderator actions export The moderator actions export provides a list of all moderator activities on the platform.
  • The type of moderator actions performed per timeframe
  • The amount of moderator actions per moderator
Login export The login export provides a list of all users who have logged in, within this specific time range. 
  • Logins per timeframe
  • Logins per module (forum or control)
  • Logins per user(rank)
Mark as answer export The mark as answer export provides an overview of all topics that were marked as having an answer by either the moderator, a super user or the topic author.  


Note on Variability Between Dashboard and Export Metrics

Due to the nature of data handling in the system, there can be apparent discrepancies between the metrics observed in Dashboards and data obtained through Exports. The underlying reason for this difference lies in how and when data is updated and retrieved in each system.

Dashboards depend on a batch data update process. Every three hours, the system takes new data and dumps it into the Analytics database. This database is what the Dashboards query whenever data requests are made through the UI. Therefore, between these batch updates, the Dashboard will present data as it was at the last update, potentially omitting more recent activity.

Data Exports, on the other hand, pull real-time data whenever an export request is initiated through the UI. This means that data exports reflect the most current data available in the database at the time of the request, unlike the dashboard, which may show slightly older data.


Example Scenario: Let's say the data dump to the analytics database occurs at 12:00 AM UTC, with the next update scheduled for 3:00 AM UTC.

  • Export at 12:30 AM UTC: At this time, the Dashboards will still show the data as of 12:00 AM UTC. However, the export output will include data captured between 12:00 AM and 12:30 AM UTC.
  • Export at 1:00 AM UTC: Similarly, the Dashboards will remain unchanged, still showing data from 12:00 AM. However, your export would include data from the new timeframe, 12:00 AM to 1:00 AM UTC.

This methodology means that metrics between the Dashboards and the Exports won’t align exactly unless there is no activity in the community during the dump intervals. Understanding this time-bound difference is essential for properly interpreting the data from each source.


What I would expect from the user report is ALL activity during a date range, regardless of registration date. Is there a way to do that, or does it have to be an *all time* export in order to get that info?


@Milla not yet, but category will be in the Topic or Posts export and you can filter from there. URL is in the topic export as well. 

If you want a more on demand report that is filterable, you could set up something using the REST API and filter the data to show you what you need, although I don’t know that it’ll give you view counts :( 


Thank you for your response @DannyPancratz 

What I need is the URLs of all published content by category, so we’ll look at this route.


Thanks! 


Topic export Offers a list of all topics created.
  • Topics created per timeframe
  • Topics created per user(rank)
  • Topics created per category set/category
  • Created topics per type (question or discussion) per timeframe
  • Most viewed topics (created in timeframe)
  • Most commented on topics (created in timeframe)
  • Topics with a label


What does these actually mean:

  • Most viewed topics (created in timeframe)
  • Most commented on topics (created in timeframe)

And how about these. Now is August ´24 and I export topics from January ´24

  • Does total_views and total_comments include all the views and comments between Jan-Aug ´24, or just Jan ´24?
  • If there is comments added, somewhere between FEB-AUG, I presume these topics arent listed in this export?

I keep wondering, if the Topic export is better than Post export. I would like to build pivot where I can find topics users have discussed. Topics can be new ones (published in this week or this month) or old ones (replies to the old topics).


Hi @revote 

In your example if you create an Export in Aug 24 of TOPICS created in Jan 24, you will get all views and stats from date of publication to export date.

So you could get a topic (A) published in jan 24 that has 10 comments, but also a topic (B) created in jul 24 that has 25 comments.

So the most commented will be topic B.

Exports contain instantaneous metrics at the time of export and not time based metrics.


So for these

  • Most viewed topics (created in timeframe) - TOPICS CREATED DURING YOUR EXPORT TIMEFRAME THAT HAS THE MOST VIEWS (from date of publication to export date.)
  • Most commented on topics (created in timeframe) - TOPICS CREATED DURING YOUR EXPORT TIMEFRAME THAT HAS THE MOST COMMENTS (from date of publication to export date.)

In your example if you create an Export in Aug 24 of TOPICS created in Jan 24, you will get all views and stats from date of publication to export date.

Okay, this is clear but


So you could get a topic (A) published in jan 24 that has 10 comments, but also a topic (B) created in jul 24 that has 25 comments.

So the most commented will be topic B.

Exports contain instantaneous metrics at the time of export and not time based metrics.

this one isnt. Why report from January includes topic from other months as well?


@revote Thanks for correcting me. Quite right. Re reading it now it doesn't make sense to me either,

Your export time frame is January 2024.

You do the export in August and you will have a view / comment count up to the date of export.


Exports contain instantaneous metrics at the time of export and not based on date window selected.


Exports contain instantaneous metrics at the time of export and not based on date window selected.

Okay, thanks. Now this is clear.


@Julian how to extract these exports and load into our datalake everyday 


@maheshm - The exports can only be run manually.  So if you’re looking for a fully automated approach, you might want to consider another path.  I’d recommend looking into our new data lake capability.  You’ll find lots of information available here: https://communities.gainsight.com/data-catalog-connectors-313


Would the API / other solution help provide a view into customer led resolutions? I am being challenged to measure this, especially when we kickoff with a specific tier of customers. We do currently have an integration with Salesforce. 


Hi ​@ryanne.perry - I’m not sure exactly how you define or ideally would like to measure ‘customer-led resolutions’, but if you mean the impact of answers being provided by the community, you can get quite far with the numbers in the native dashboards.  For example, I use a chart where I combine the following data points, which are all available in the native dashboards:

  • # Questions asked (which I filter for our Product Q&A areas)
  • # Questions answered 
  • % Questions answered 
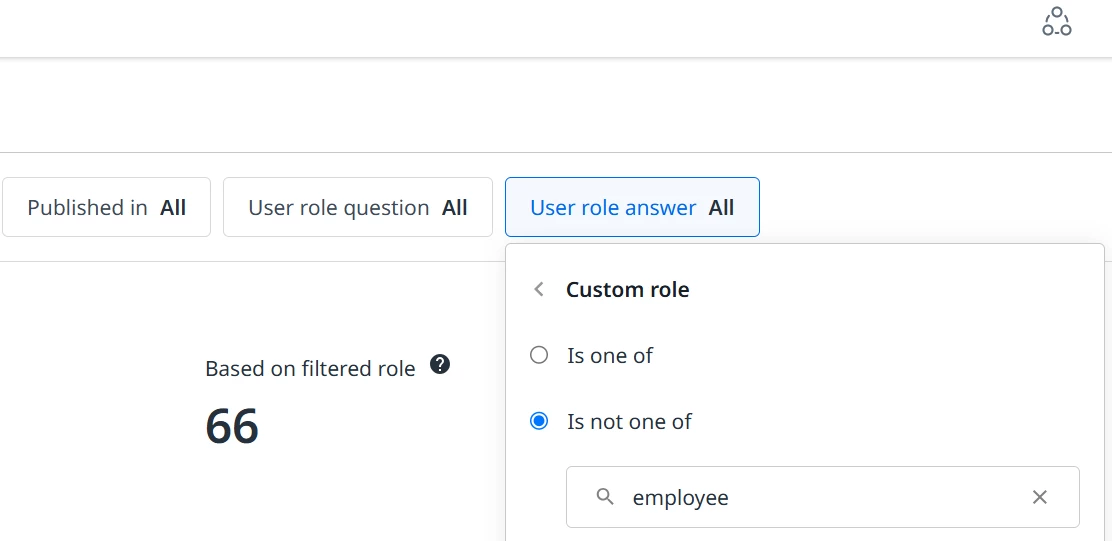
  • % Answers provided by non-employees (we have a custom role that distinguishes Gainsight Employees, which we can then exclude here)
  • I also choose to include # Single User Topics (also filtered for our Product Q&A areas)

Is something like this what you’re looking for, or are you thinking of something else?


Thanks ​@Kenneth R - this is helpful! For this bullet, if an employee is on the thread but other customers also provided support, will it exclude the question since I excluded employees or will it include it because other customers replied to as well?

  • % Answers provided by non-employees (we have a custom role that distinguishes Gainsight Employees, which we can then exclude here)

Hi Ryanne, nice to see your name here :) 

So our Dashboards actually allow you to apply this filter only for the person that provided the answer - however we also have a second filter that would do the very same for the Author of the question:


This means you should be able to filter out any engagement that falls outside of your definition of this KPI - however it will require of course that you have such a role assigned to the respective accounts for this to work properly.

Hope this helps!?


Reply