
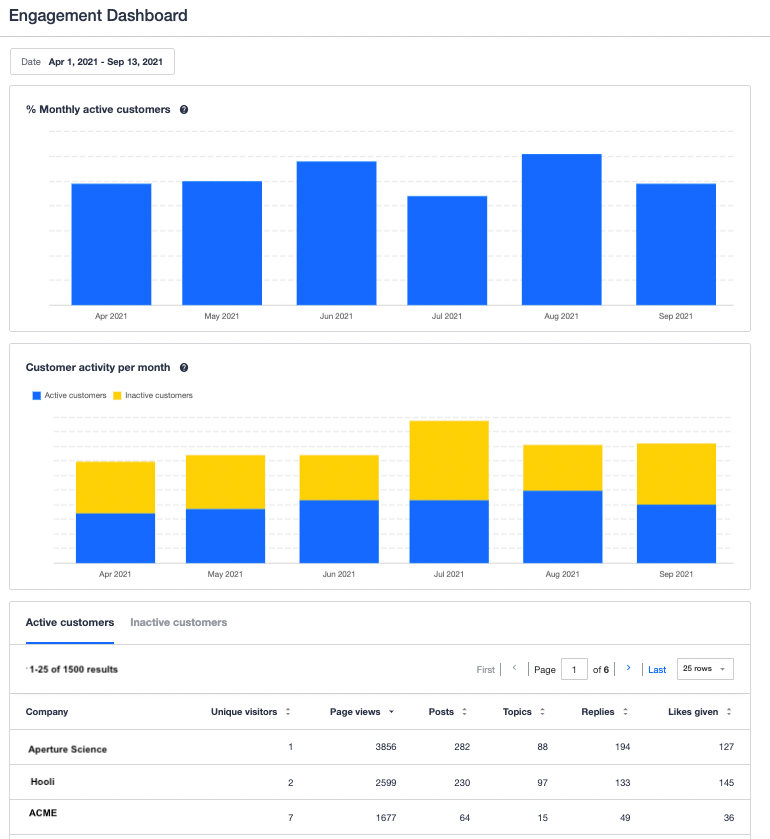
Specifically built for community managers at B2B Software companies, the engagement dashboard enables you to get insights into how active your customers are on a company/account/logo level. You can also measure the breadth of community engagement in the context of your entire B2B customer base. These insights can help demonstrate the value of the community, inform your engagement strategy, and help you measure the success of your efforts to engage your customer base.
This article dives into more detail on what data is available on the engagement dashboard, and how key metrics are calculated.
☁️Prerequisite: Salesforce Account Import integration required
The Engagement dashboard requires company data to show you customer analytics. Currently we only enable customers using Salesforce to retrieve this data with our integration to Import Salesforce Accounts to CC.
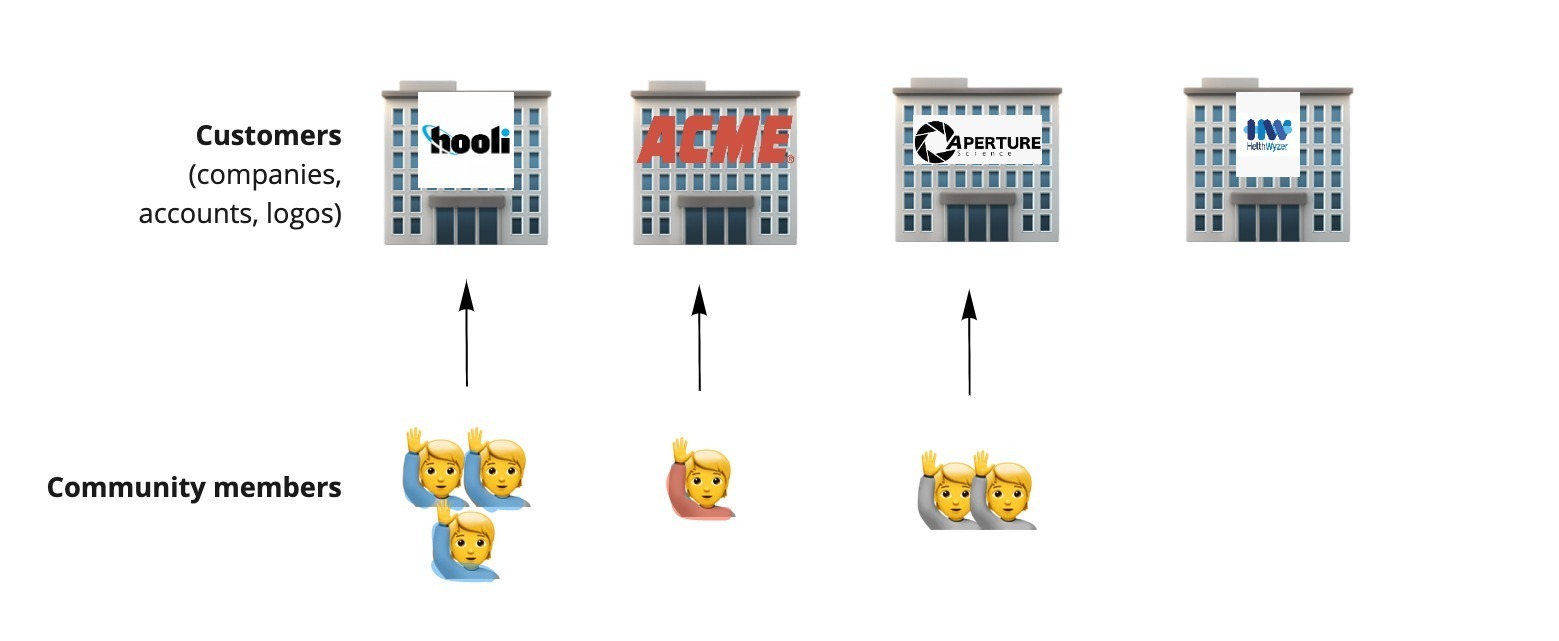
What is a ‘customer’ and how does it relate to a community member?
Since the engagement dashboard was built with B2B Software companies in mind, we use the word ‘customer’ to refer to any company (logo/account) who is a customer of your business. A customer can have one or more community members linked to it.
Before we dive into the key metrics, here are a few related definitions to help you navigate the dashboard:
- ?♀️ ‘Customer’ refers to any company that has been imported into CC with the status ‘customer’.
- ? ‘Active customer’ refers to any company where at least one community member who is linked to the company viewed at least one page in the community.
- ? ‘Inactive customer’ refers to any company where either no community members linked to the company viewed a page in the community, or, where there are simply no community members linked to the company at all.
Key metrics and how they’re calculated
?% Monthly active customers (MAC)
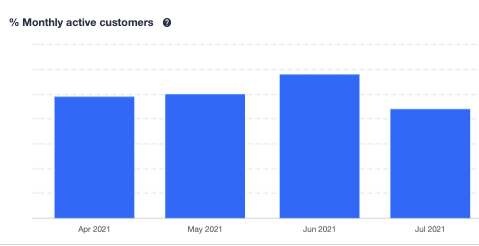
This is the key value metric of the dashboard, telling you the ratio of the count of active customers to the count of total number of customers in a given calendar month.
The total number of customers is based on the number of customer companies that have been imported to CC, regardless of whether there are any community members registered who work at those companies.
Customer activity per month
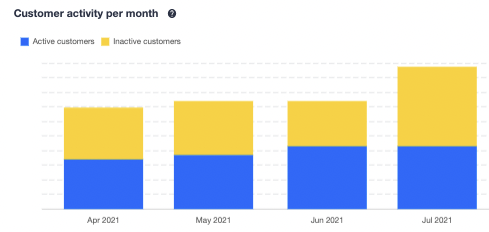
The active and inactive customer metrics of this chart are used to calculated the % monthly active customers metric: % monthly active customers = (active customers / active + inactive customers)
Active customers tells you how many customers were active in a given calendar month (at least one community member linked who viewed at least one page on the community).
Inactive customers tells you how many customers were inactive in a given calendar month (no page view from any linked community members, or simply no community members registered at all).
? A note on ‘churned’ customers
If a customer churns (is no longer marked as a customer) in a given calendar month, they will still be counted amongst active and inactive customers up until the end of the month. E.g. if a company churns in August, then they are counted as either an active or inactive customer up until the end of August.
Active + Inactive customers
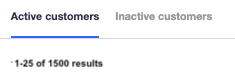
Above the table showing which customers were active/inactive, you can find a count of the customers who were active or inactive in the selected time period.
E.g. if you select a date range at the top of the dashboard from January-December 2021, you can see a count of the total number of your active customers for 2021.
The same note around churned customers applies to this table.
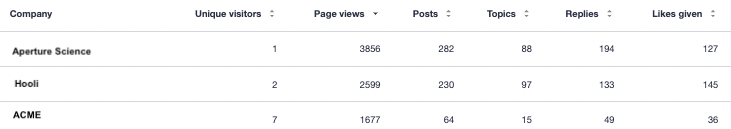
In this section of the dashboard you’ll also find a breakdown of engagement per customer. Most of the metrics here are similar to those you’ll find on the user dashboard but simply summed together and aggregated at a company level.
Identifying highly-engaged ‘lurker’ customers
Unique visitors + page views can help you identify highly engaged ‘lurker’ customers - customers who might be viewing a lot of content but aren’t contributing to the community.
Unique visitors refers to the number of unique community members linked to a particular company who were active in the selected time period. Page views refers to the sum total number of page views by community members linked to a particular company (repeat page views e.g. refreshes are included).
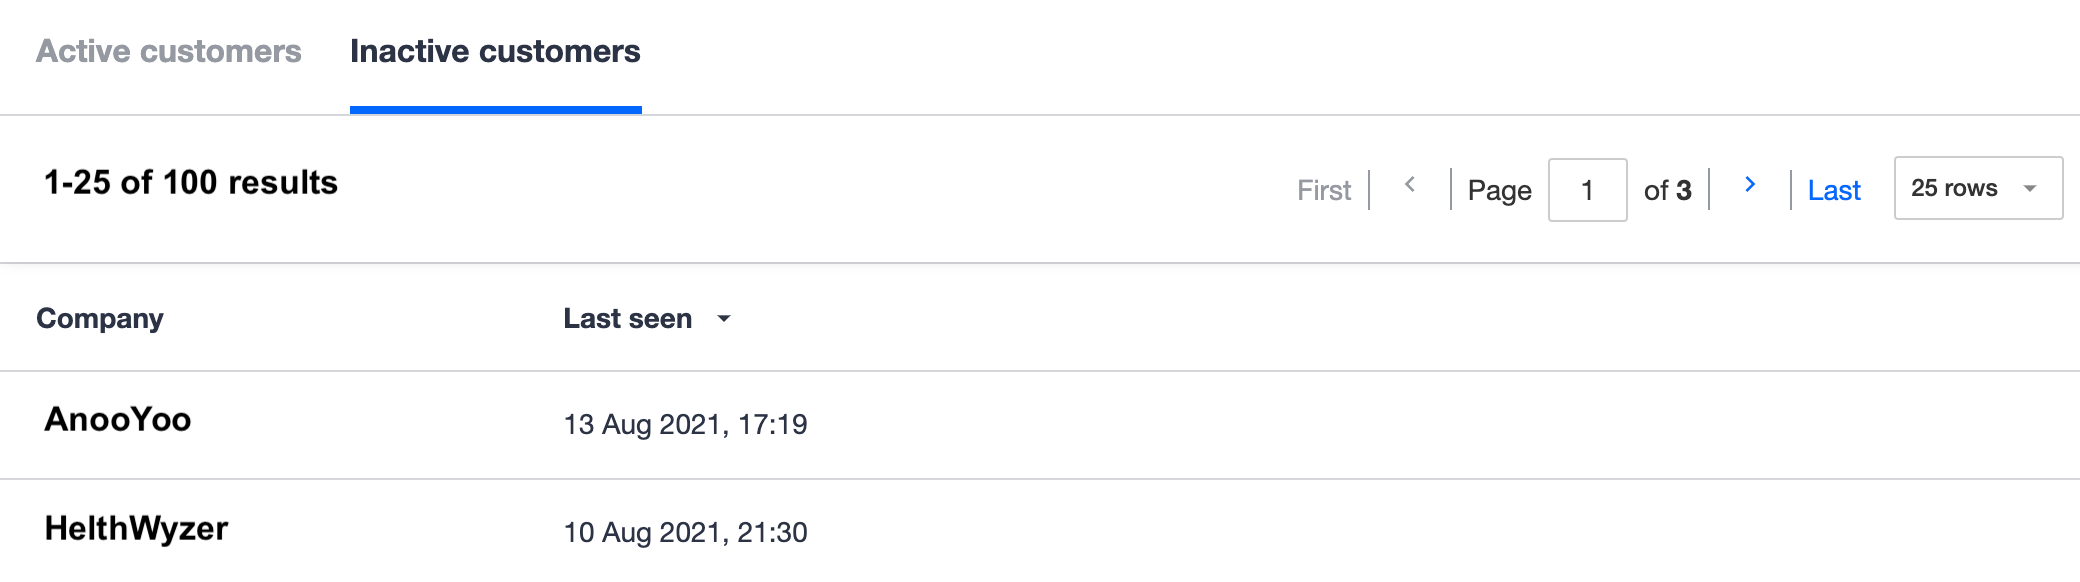
On the inactive customers tab, you’ll find a list of inactive customers along with their ‘last seen’ date and time. This refers to the last recorded page view by a community member linked to the company. This is sorted so that you can view the most recently ‘seen’ companies first. If a company has never recorded a community member page view, or there are no community members linked to that company, then you’ll see ‘Never’ shown in this column.
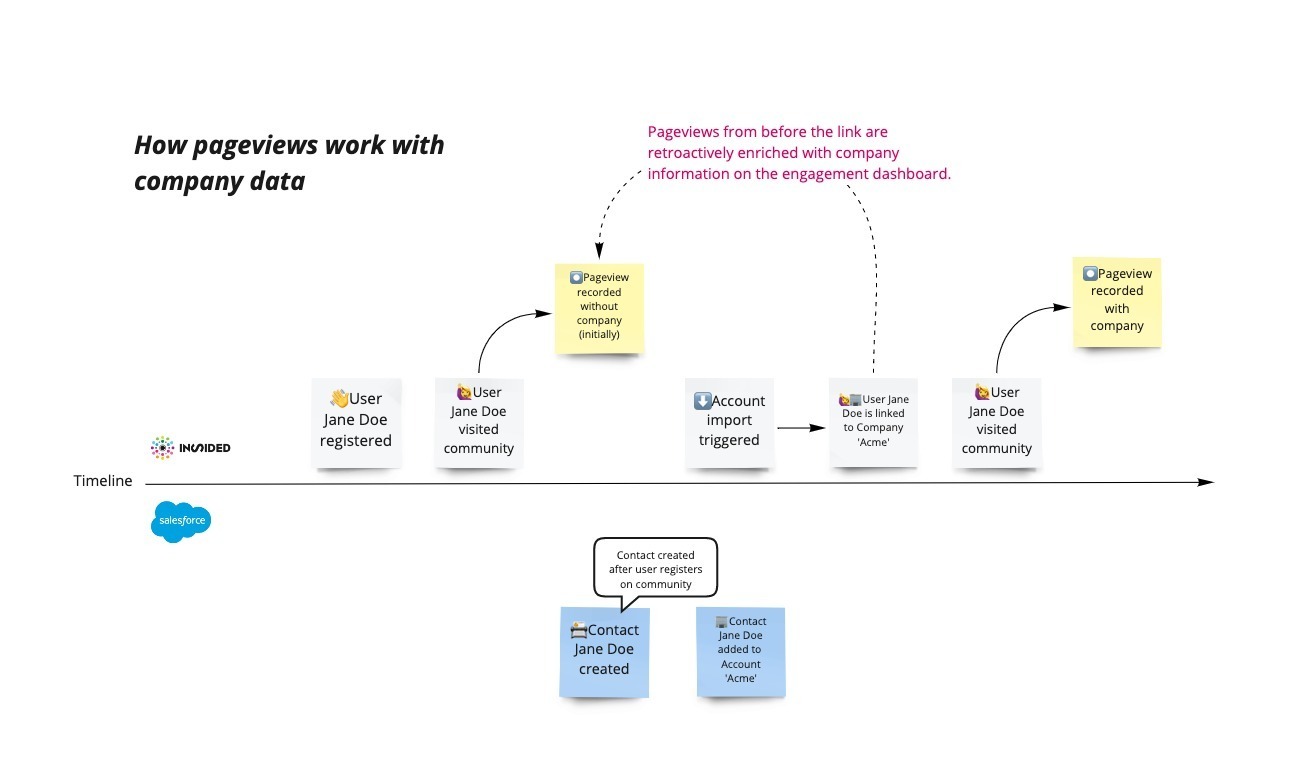
How page views are linked to companies via community members
Once community members are linked to a company, any historical page views where the community member was logged in are retroactively enriched with company data.
That means no matter how late a community member is linked to a company, you’ll be able to backtrace their contribution to company engagement on the engagement dashboard.
? Known limitations
- Anonymous visits and page views (where a community member has not registered yet or is simply not logged in) are not linked to companies. This means that lurkers at your customers who are not logged in or registered will not be counted in the engagement metrics.
- The engagement dashboard can only be used if you set up the Salesforce Account Import (available on the business package and above). Other CRMs are not currently supported - please let us know in the replies if you use another CRM and are interested in using the engagement dashboard.