🚀 Gainsight PX July 2024 Release is Live!

  • 29 July 2024
  • 5 replies
  • 319 views


📢 The PX July Release is now Live in US and EU Orgs! 

Our July update introduces streamlined processes, added benefits, and enhanced usability for essential features. Check out our release notes for more information. 

Release Highlights:

  • Comparison Widget: Compare widget data across different scenarios to gain insights into performance and trends.
  • Improved Information Visibility in the Feature Performance Widget: Feature names now appear as legends for easier identification, along with the ability to customize widget dimensions for a tailored dashboard experience.
  • Automation Settings in Guide and Survey Engagements: Now featuring Timeout and Initial Delay configurations for improved user interaction and seamless engagement creation.
  • Optimized Grouped By Selection in Feature Adoption Reports: The Feature Adoption report now includes an intuitive slide-out panel for faster and easier selection of features, countries, and more.

++------------------------------------------------------------------------++

RELEASE NOTES
++------------------------------------------------------------------------++

FYI   @dstokowski   @MatthewWasley @robert_lakin @Tori Jeffcoat @harshibanka @Umakanth @dileepnalla @kathleenkenny23 @link_black  @skalle @Chandu @aharkut   @neelam_mukherjee @jared_block 

Follow this post and/or subscribe to this category to automatically receive updates when new content/document/communication is posted.

As part of the April 2024 release, we have published and/or updated the following articles: 


Is anyone able to get the comparison widget to work? From my limited experience:

  • I can add a comparison widget only from the menu of a KPI widget that is already on my dashboard
  • The comparison widget always compares the time period in my existing widget with the past 7 days - even if I select different time periods
  • After I add the comparison widget, I can change filters or the title, but not the time period

Is the purpose of this widget solely to compare two groups of users/accounts in the same time period via filters?


Looping in @Chandu to add more insights here. 


Hi @mmarques 

Thank you for your questions, Please find my responses inline:

  • I can add a comparison widget only from the menu of a KPI widget that is already on my dashboard

    This is correct and has been detailed in the documentation: https://support.gainsight.com/PX/Analytics/Dashboard/Configure_Comparison_Widget
    Compare action is only available for select KPI widgets at the moment and is accesible from the more actions (kebab menu) from such widgets added on the dashboard. The resultant widget of the compare action is the comparison widget that gets added on the dashboard, comparing two scenarios - 2 combinations of Time period, Channels and Custom Filters for the same widget eg: New Users
     
  • The comparison widget always compares the time period in my existing widget with the past 7 days - even if I select different time periods

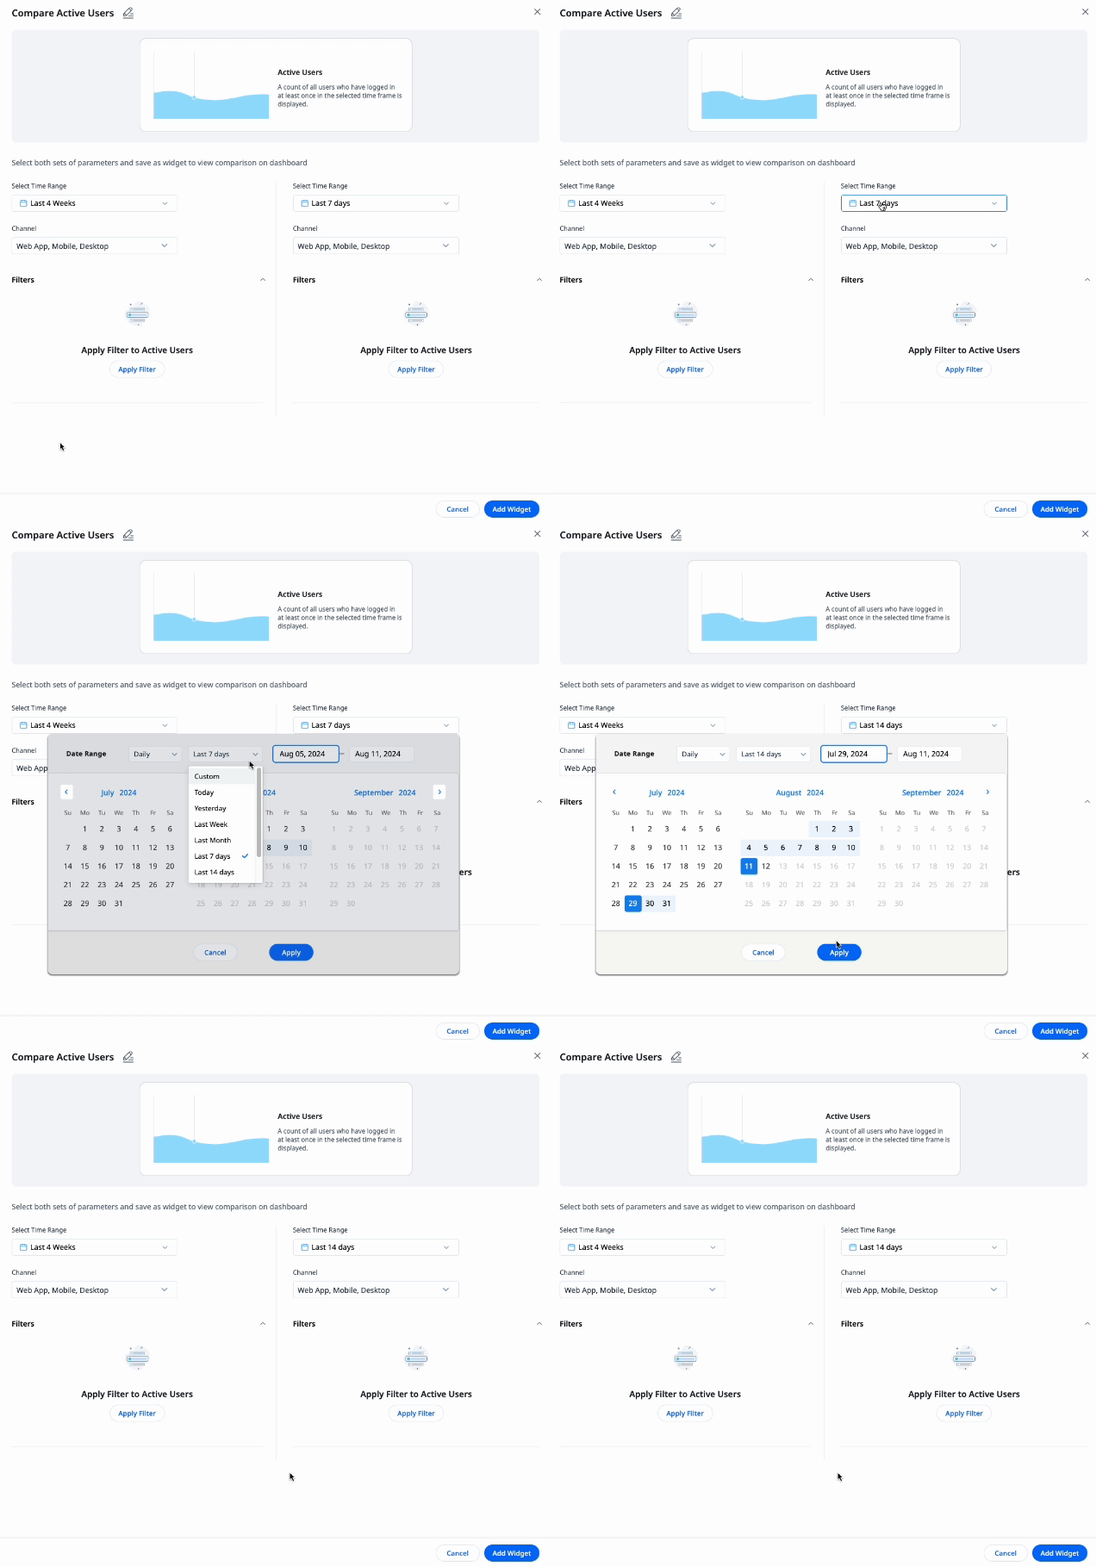
    You should be able to change the Past 7 days here which is a default populated value for the widget to reduce the number of clicks. Attached a quick view below:
    (Please note the GIF is in a loop. Not to confuse with the 14 days selection not being honoured and reverting to 7 days )


  • After I add the comparison widget, I can change filters or the title, but not the time period

Is the purpose of this widget solely to compare two groups of users/accounts in the same time period via filters?

As stated above, you can compare 2 scenarios of the widget; Scenario is a combination of time period, channel and custom filters. To change the time period, click the filter icon on the comparison widget and you will land on the same screen as in above gif where you can change the time periods. 

Hope the above helps. Thank you!


Thanks, @Chandu  - I can now get the comparison. However, I think that I might still use separate widgets. I am trying to compare the effect of a change that I made in the product, but we also got many new users. So, the % increase based solely on the # of people accessing the features doesn’t tell the whole story. Seeing the % users before and the % users after the change is what I need. 


Reply