Congratulations! 🎉 You’ve established PX<>CS connection and there is now valuable adoption data flowing from PX into CS. But how do you know the data is trustworthy? The robust capabilities of the PX and CS platforms allow users to slice and dice the data in various ways, which can result in what may appear as a discrepancy between metrics shown in PX and CS.

Building the reports below will allow admins to compare “apples to apples” when validating PX data in CS and increase their confidence that the adoption metrics seen are accurate.
Before generating the following reports to compare data in PX and CS, it is important to first understand how data gets from PX to CS. Once every 24 hours, a job runs to load usage data from PX into CS. This raw data is loaded into CS with no manipulation or tampering. Therefore, as long as the appropriate reports are being compared with each other, admins can rest assured that the data from PX is identical in CS.
Verify Product Map
It is important to ensure the features that are mapped in PX are accurately reflected in CS. To do so, we will run a report in CS to view feature names and paths. This will draw attention to the naming conventions used in the PX Product Mapper.
-
Create a CS Report with the following fields
-
MDA: GPX to CS Company Time Series Daily
-
Show Me:
-
Feature Events Count
-
-
Group By:
-
Feature Name
-
Feature Path
-
-
Compare feature names and paths in CS report with the Product Mapper hierarchy in PX for accuracy. This is a great opportunity for users in CS to gain an understanding for the nomenclature used in PX and how that results in feature definition. For example, viewing the Product Mapper alongside this CS report can demonstrate the difference between 2 “Submit” feature names. This understanding will be helpful to ensure the accuracy of future report building.
Example:
| Feature Name | Feature Path |
| Submit | Home/Users/Add New User/Submit |
| Submit | Home/Reports/Add New Report/Submit |
Verify Accounts Explorer
A major component of PX<>CS integration is to ensure that Accounts in PX can be identified as Companies in CS. To ensure there is appropriate identification of Accounts and Companies, we'll run the following CS report and compare it with the Accounts Explorer in PX.
-
Create a CS Report with the following fields
-
MDA: GPX to CS Company Time Series Daily
-
Show Me:
-
Account Events Count
-
-
Group By:
-
Company Name
-
Company ID
-
-
Filter: Date = Last 30 Days
-
-
In PX Accounts Explorer, match the date filter with that on the CS report.
Now it is time to compare apples to apples again! Compare Company Name, ID and Number of Visits with Account Events Count.
| PX Field | CS Field |
| Company Name | Company Name |
| ID | Company ID |
| Number of Visits | Account Events Count |
Verify Active Users
Now that we have an understanding of the feature map/naming convention and we've verified that Accounts in PX are mapped to Companies in CS, we need to ensure that user activity is being appropriately fed from PX into CS. To do this, we’ll compare the Adoption Explorer Active Users widget with a custom PX report built via Query Builder.
-
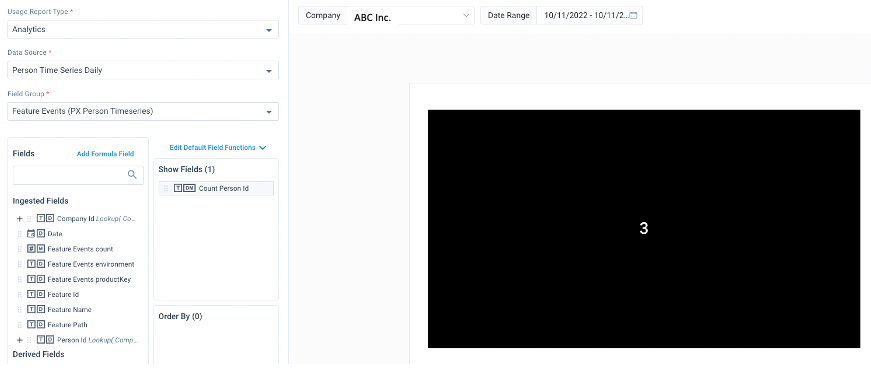
In CS Adoption Explorer, navigate to the Active Users widget (this is an Out of the Box metric created on the default company dashboard). If this widget is not already configured, use the criteria below to build it.
-
Source: Person TS Daily
-
Field Group: Feature Events
-
Field: Count of Distinct Person IDs
-
Date Range: Choose a specific date. Because PX data is sent to CS once every 24 hours, comparing time-stamped data by the week/month can result in data discrepancies. Choosing one specific date to compare active users in PX and CS is the most accurate method of comparison.
-

-
Build a report in PX Query Builder with the following criteria
-
Events: Feature- Any Feature
-
Audience: Account ID = (Choose an account ID from Account Explorer)
-
-
Show By: Unique Users
-
Pro-Tip: Save this Report for future use
Select the same date chosen in the Adoption Explorer Active Users widget. Compare the Number of Active Users in CS Adoption Explorer widget with the Number of Unique Users in PX Query Builder Report for the same company. Using this method, spot-check a number of companies/accounts across various dates to ensure active users tracked are consistent across PX and CS.
Verify Feature Adoption
The last recommended piece of validation needed to increase the trust of cross-platform data is to verify that feature adoption metrics are synonymous across PX and CS. As with Active User validation, we will compare a CS Adoption Explorer widget with a PX Query Builder report.
-
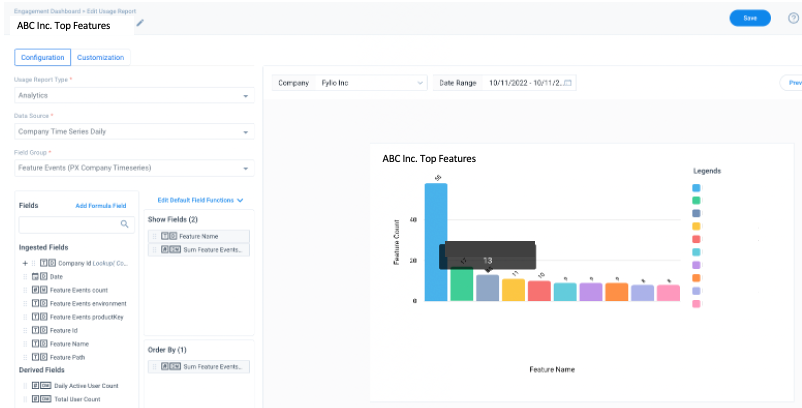
In CS Adoption Explorer, navigate to the Top Features widget (this is an Out of the Box metric created on the default company dashboard). If this widget is not already configured, use the criteria below to build it.
-
Source: Company TS Daily
-
Show Fields:
-
Feature Name
-
Sum of Feature Events count
-
-
Order By
-
Sum of Feature Events count
-
Date
-
-
Date Range: Choose a specific date
-

-
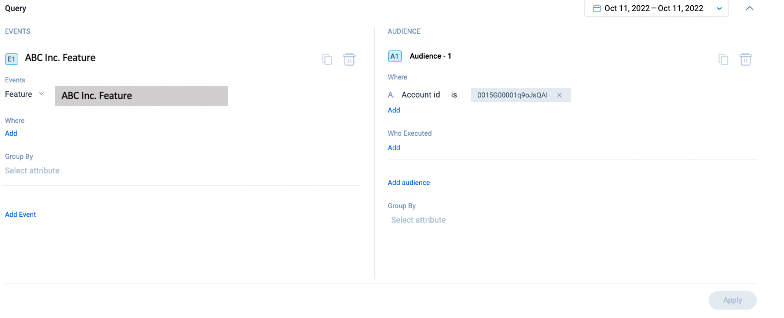
Build a report in PX Query Builder with the following criteria
-
Events: Feature- choose feature from Adoption Explorer Top Features widget
Note: This is why the first validation exercise, “Verify Product Map,” is important. Refer to this step to ensure you are comparing the same feature name/feature path from the CS widget with the PX Query Builder report filter
-
Audience: Account ID = (Choose an account ID from Account Explorer)
-
Pro-Tip: Save this Report for future use
-
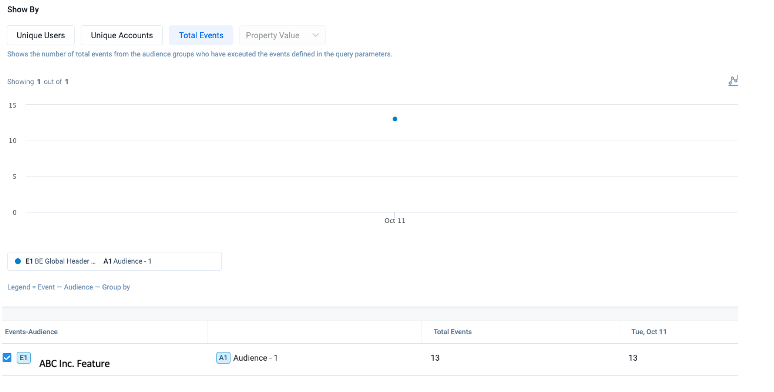
Show By: Total Events


Select the same date chosen in the Adoption Explorer Top Features widget and PX Query Builder reports. Compare the Sum of Feature Events Count in the CS Adoption Explorer Top Features widget with Number of Total Events in PX Query Builder Report for the same feature, same company, and the same date. Using this method, spot-check a number of features, companies, and dates to ensure feature events count is consistent across PX and CS.
Trust Fall!
By going through this series of exercises, we have confirmed the hierarchy of mapped features across PX and CS, verified that Accounts in PX are tied to the appropriate Companies in CS via unique identifiers, validated that active users are tracked consistently across the 2 systems, and demonstrated that feature event data gathered in PX is accurately reflected in CS. These exercises can be used to help overcome data trust issues and increase confidence in the integrity of the telemetry data presented across Gainsight PX and CS.

What methods does your organization use to validate the trustworthiness of PX data in CS?
