
In the rapidly evolving product landscape, leveraging deep user insights to drive decisions is essential for creating successful features that enhance user engagement and satisfaction. Let’s take a look!
As many of you know, PX is a pivotal tool in this work, offering robust reporting capabilities that arm product teams with the data needed to guide both the planning and refinement of features. Today we will be focusing on the planning stage - stay tuned for part two!
I’ve tried to create a structured approach to using essential reports, crafting ROI outcomes, and understanding key metrics as leading or lagging indicators.
Pre-Release Planning: Data-Driven Development
Objective: Harness PX insights for informed feature development, with a goal to elevate user adoption and engagement.
ROI Outcome and Calculation Guide:
Before delving into specific reports, it's crucial to establish clear ROI outcomes related to our planning efforts. By having clarity on these metrics beforehand, you can begin to prioritize which features are slated for improvements (or often times, which ones should removed from your docket since your hunches about adoption may have been wrong!).
Leading Indicators:
-
Engagement Increase: Aim for a 10% increase in user engagement as indicated by key product interactions. This is predictive of future retention improvements.
- Calculation: Measure the number of ‘key feature’ interactions per user over the past quarter and set a goal for a 10% increase for the next quarter.
-
Feature Adoption Rate: Target a 20% increase in the adoption of new or underutilized features. This can lead to higher perceived value and customer satisfaction.
- Calculation: Track the current adoption rate of targeted features and aim for a 20% increase as a result of targeted onboarding and feature awareness campaigns.
Lagging Indicators:
-
Churn Reduction: Target a 3% reduction in churn rate. A more modest goal is realistic over a short period and still significantly impacts revenue and customer lifetime value (CLV).
- Calculation: From the current churn rate, calculate the impact of a 3% reduction. Use historical data to identify churn patterns within your user-base and tailor retention strategies accordingly.
-
CLV Improvement: Aim to increase the average Customer Lifetime Value by $75,000. Adjusting expectations to a smaller scale makes this goal more attainable within a shorter timeframe.
- Calculation: Assess the current CLV and implement strategies aimed at increasing it, such as improving product offerings, customer support, and personalized marketing.
-
Retention Rate Increase: Aim for a 7% improvement in retention rates. Focusing on a smaller increment allows for more focused strategies and quick adjustments.
- Calculation: From the baseline retention rate, target a 7% increase through improved feature development - but also efforts around onboarding, customer engagement, and feedback loops to identify and address user pain points.
4 ‘Anchor’ Reports for your Pre-Release Analysis Dashboard
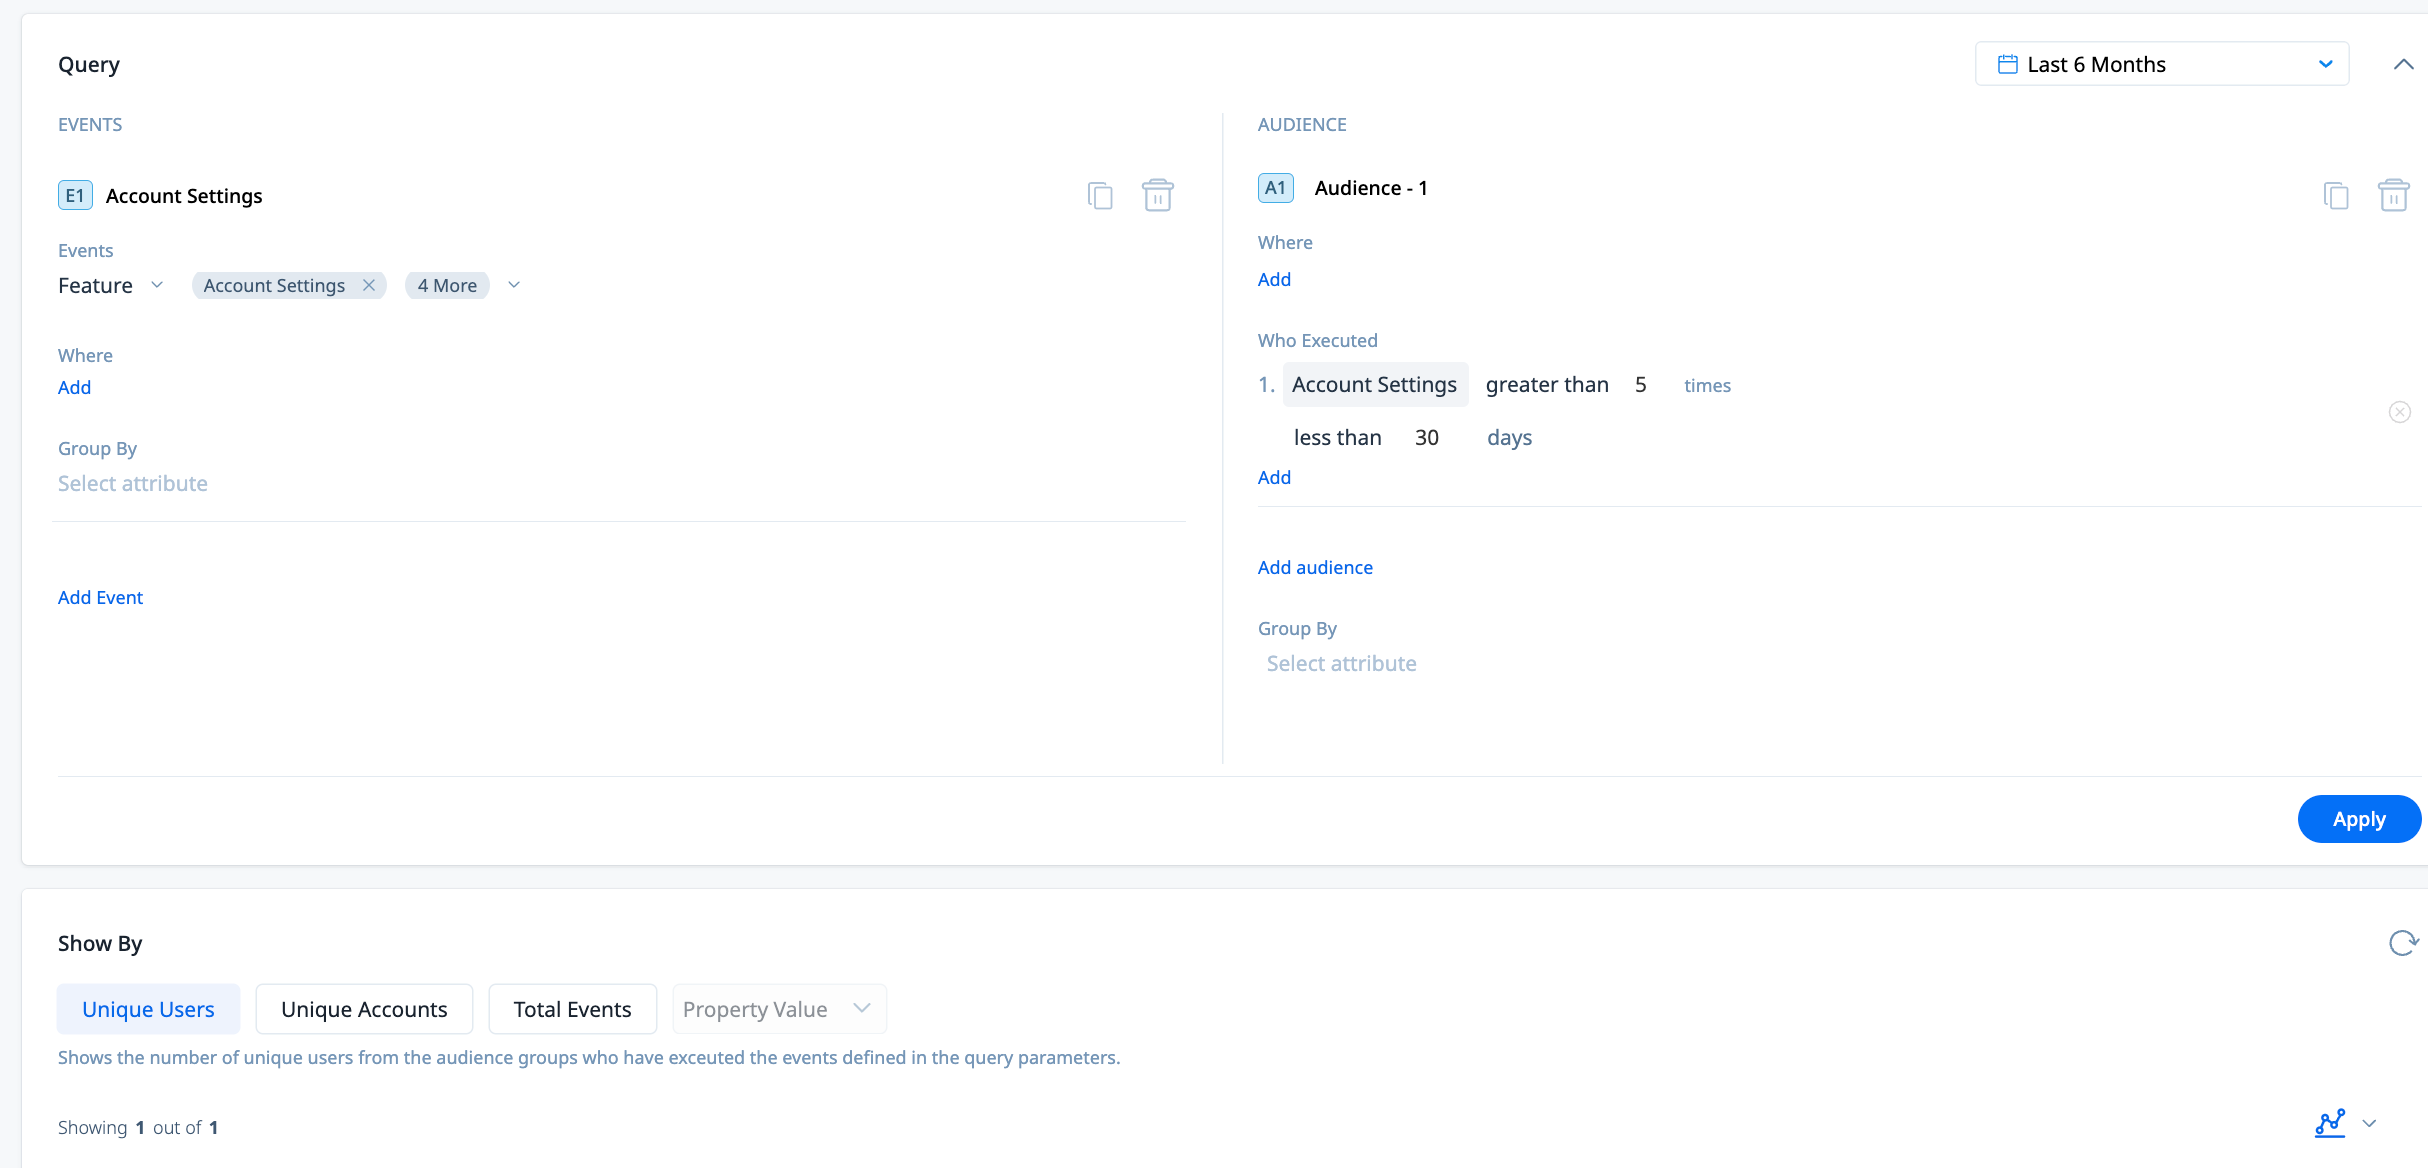
1. Query Builder - Feature Adoption
- Objective: Identify a 20% increase in the adoption of new or underutilized features, leading to enhanced customer satisfaction and perceived value.
- Gainsight PX: Use the QB to track the adoption rate of targeted features or feature sets over time. Utilize segmentation to focus on specific user groups or feature sets.
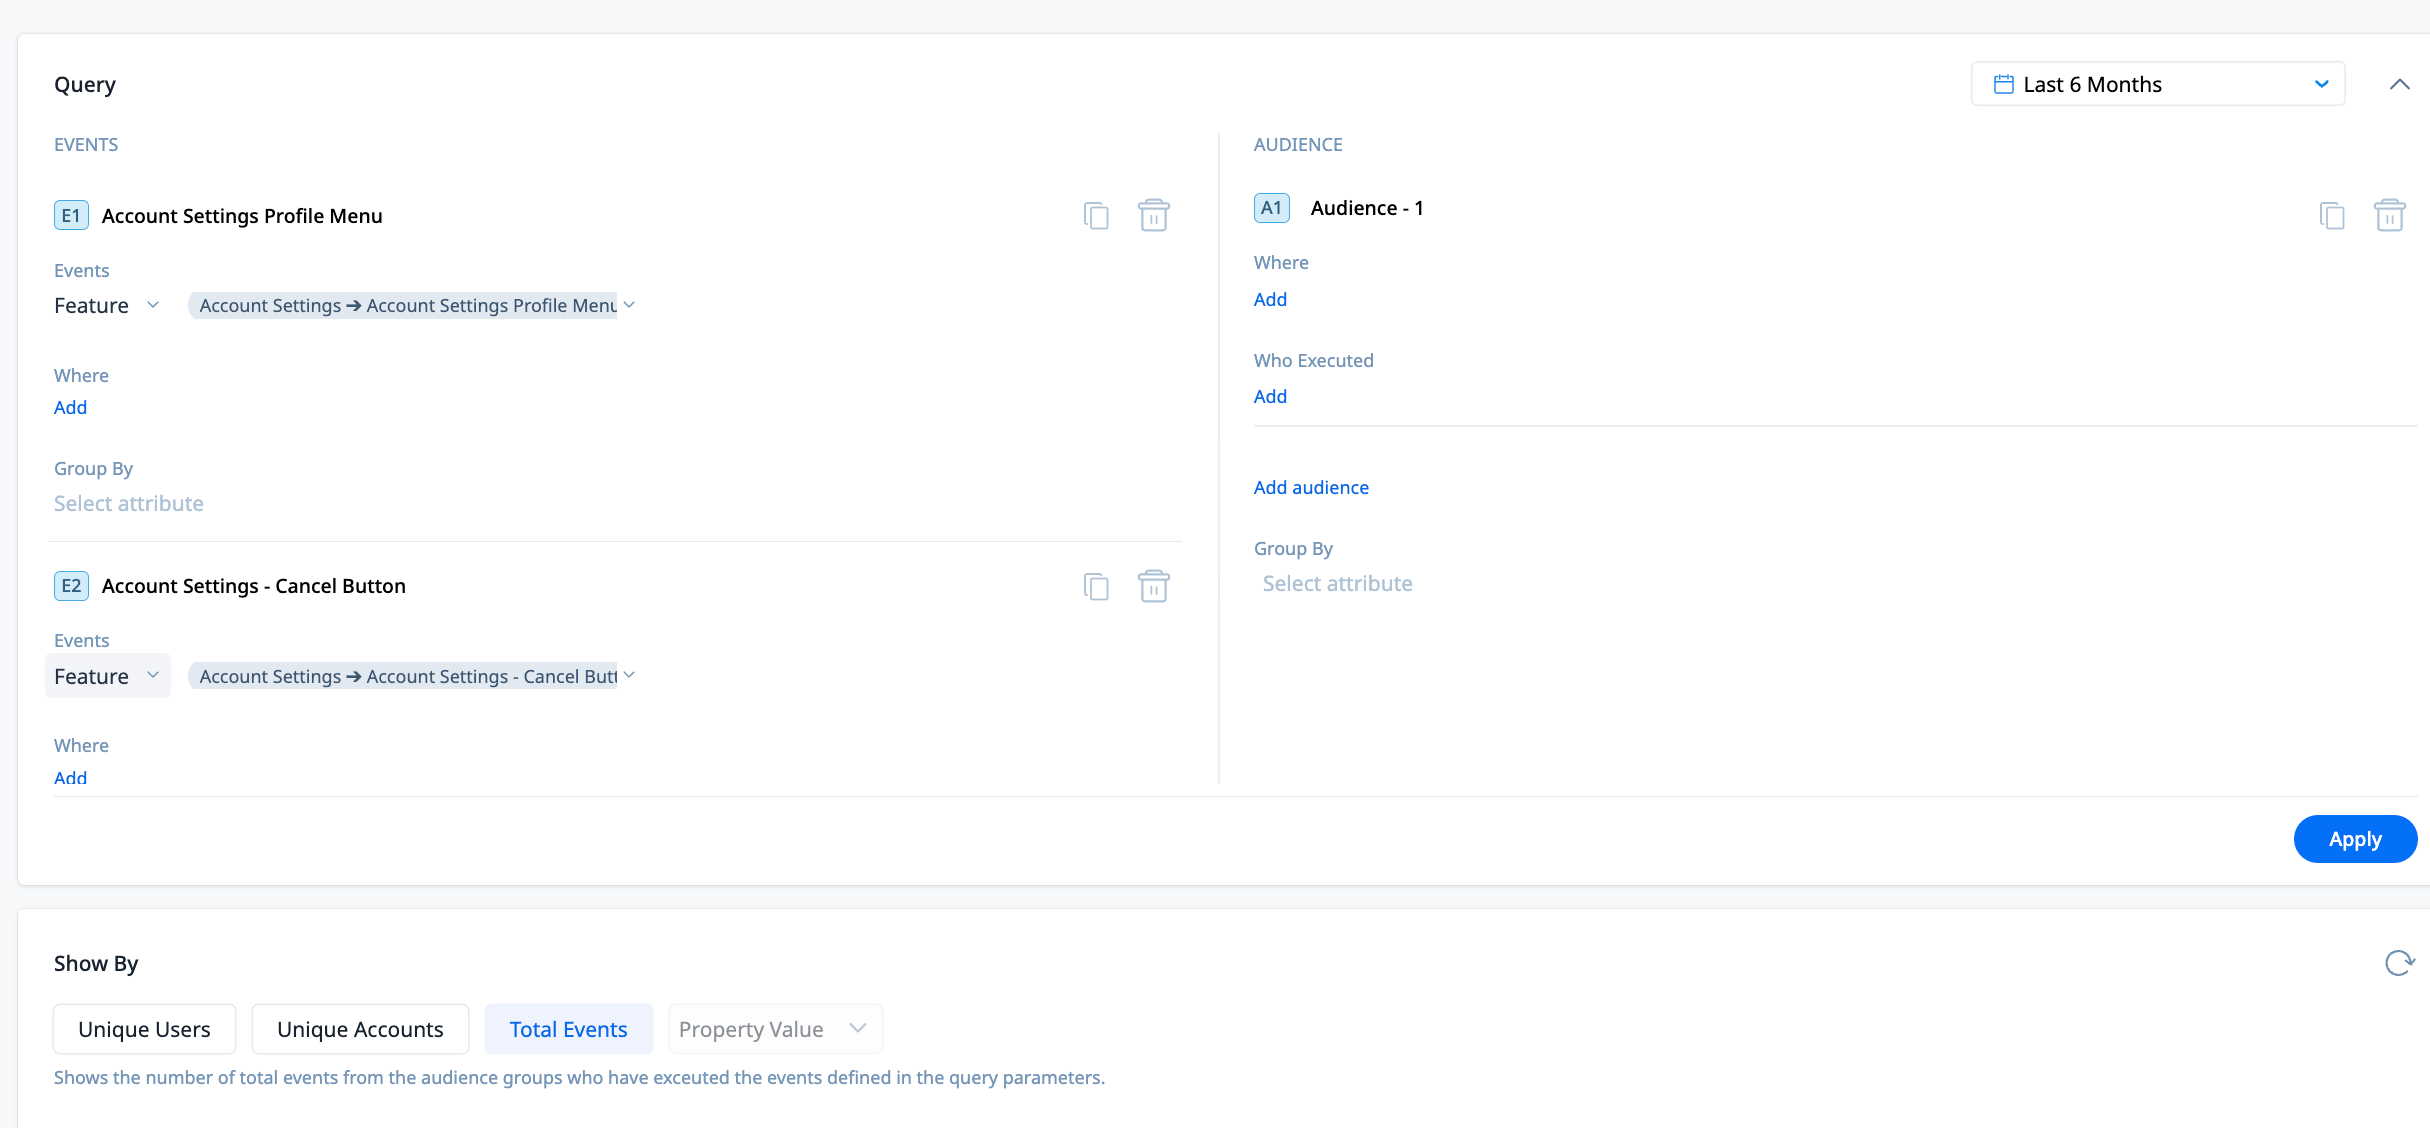
2. Query Builder - Average interactions per user
- Objective: Aim for a 10% increase in key feature interactions per user, predictive of retention improvement.
- Gainsight PX: Leverage QB to measure user interactions with key features over the past quarter, aiming for an increase in the next quarter.
3. Retention Analysis Report
- Objective: Monitor user retention patterns to implement strategies for a 7% improvement in retention rates.
- Gainsight PX: Utilize Retention Analysis to analyze user cohorts over time, identifying trends and areas for engagement improvement.
4. Funnel Analysis Report
- Objective: Outline user paths interacting with features to identify friction points and drop-offs.
- Gainsight PX: Deploy Funnels to map user journeys from feature discovery to adoption, pinpointing where enhancements are needed to improve user flow.
One last point..
In regards to allll the other options that come with dashboards (18 widgets!) - the value of these can’t be overstated. That being said, by building some of these core reports outside of the dashboard, you can use these as ‘anchors’ for your dashboard, where users can go in deeper for further analysis.
From there, you can utilize the widgets, which tend to be more oriented towards feature-specific KPIs or more realtime monitoring efforts. Which happens to set us up nicely for the post-release analysis topic so - until next time! 👋
As one last aside - I am so grateful to get to learn from our customers on what makes for an effective strategy around these pillars (as well as our own Product team’s work!). These insights are gained from my work with some of my most mature customers, as well as the best practices we have developed as a PX CS Team. :-)