A question that I was recently asked was…
“How do I get a list of users that have been ‘the most active’ in the last 30 days days that also allows me to sort by most active and least active?”
My first thought was …
“Well, it depends on what ‘the most active’ really means to you.”

One good way is by choosing a specific mapped Feature in your PX Product Map that represents a good indicator for “most active”. Here is how to do this.…
- Determine what mapped Feature event(s) that are tracked by your PX to use for this analysis.
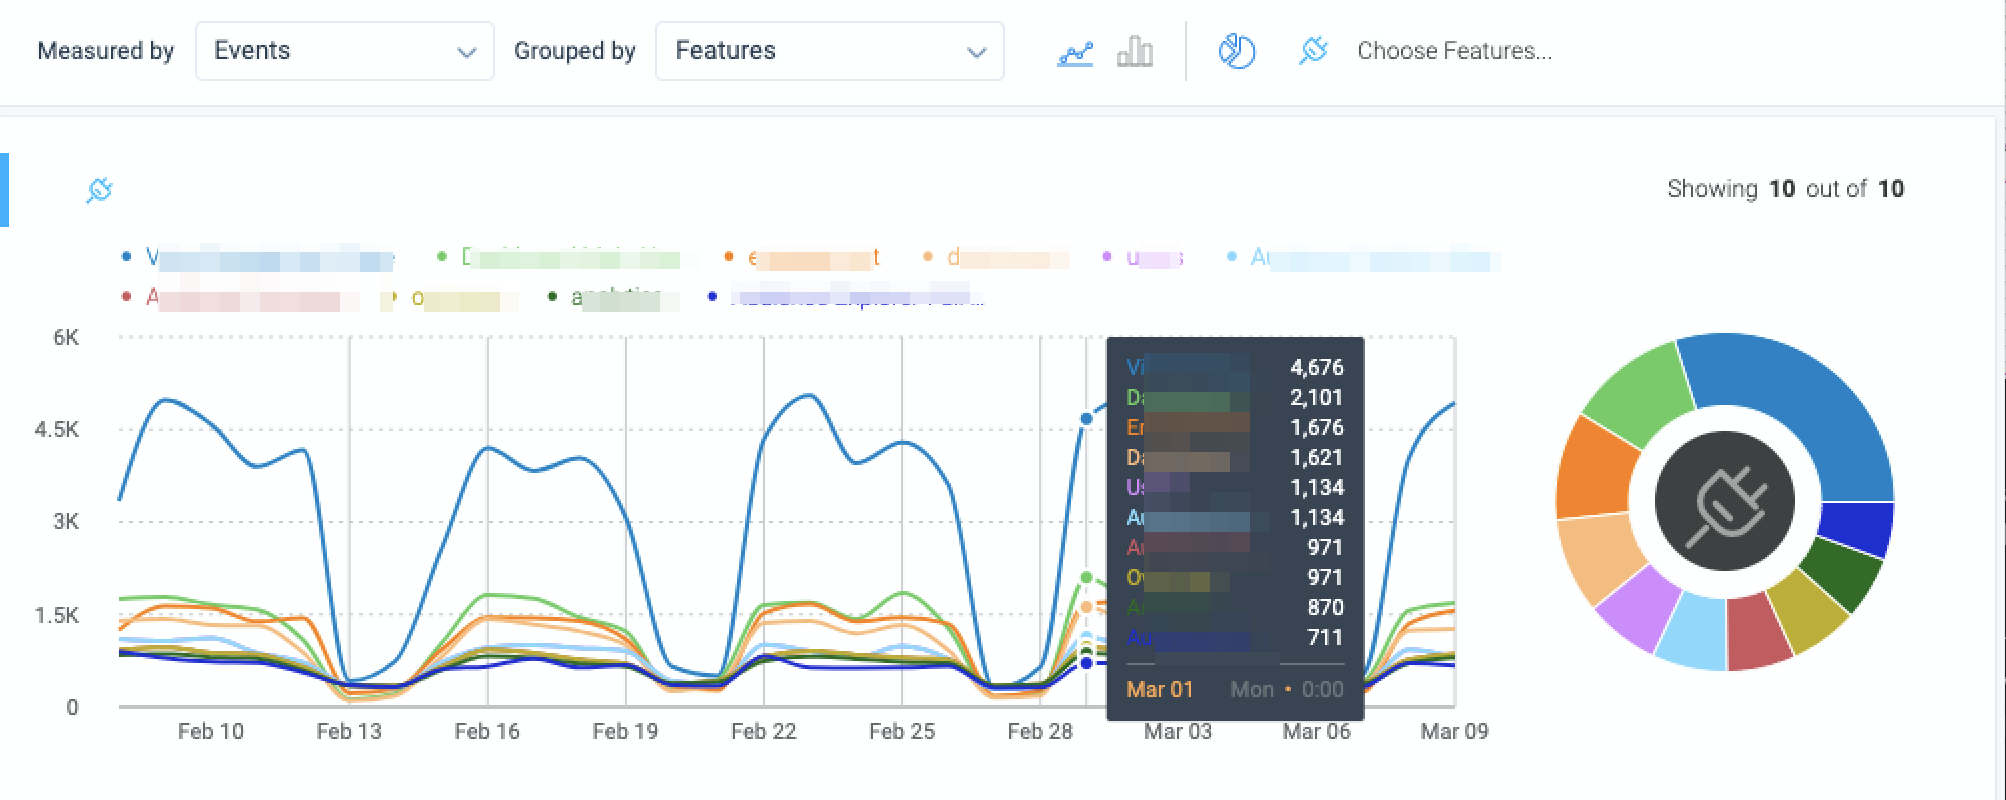
- Open the Analytics -> Adoption report. If you do not know your “top” features already, it is easy to group our Feature Adoption report by “Feature” to easily see those with the most/least events during a specific timeframe.

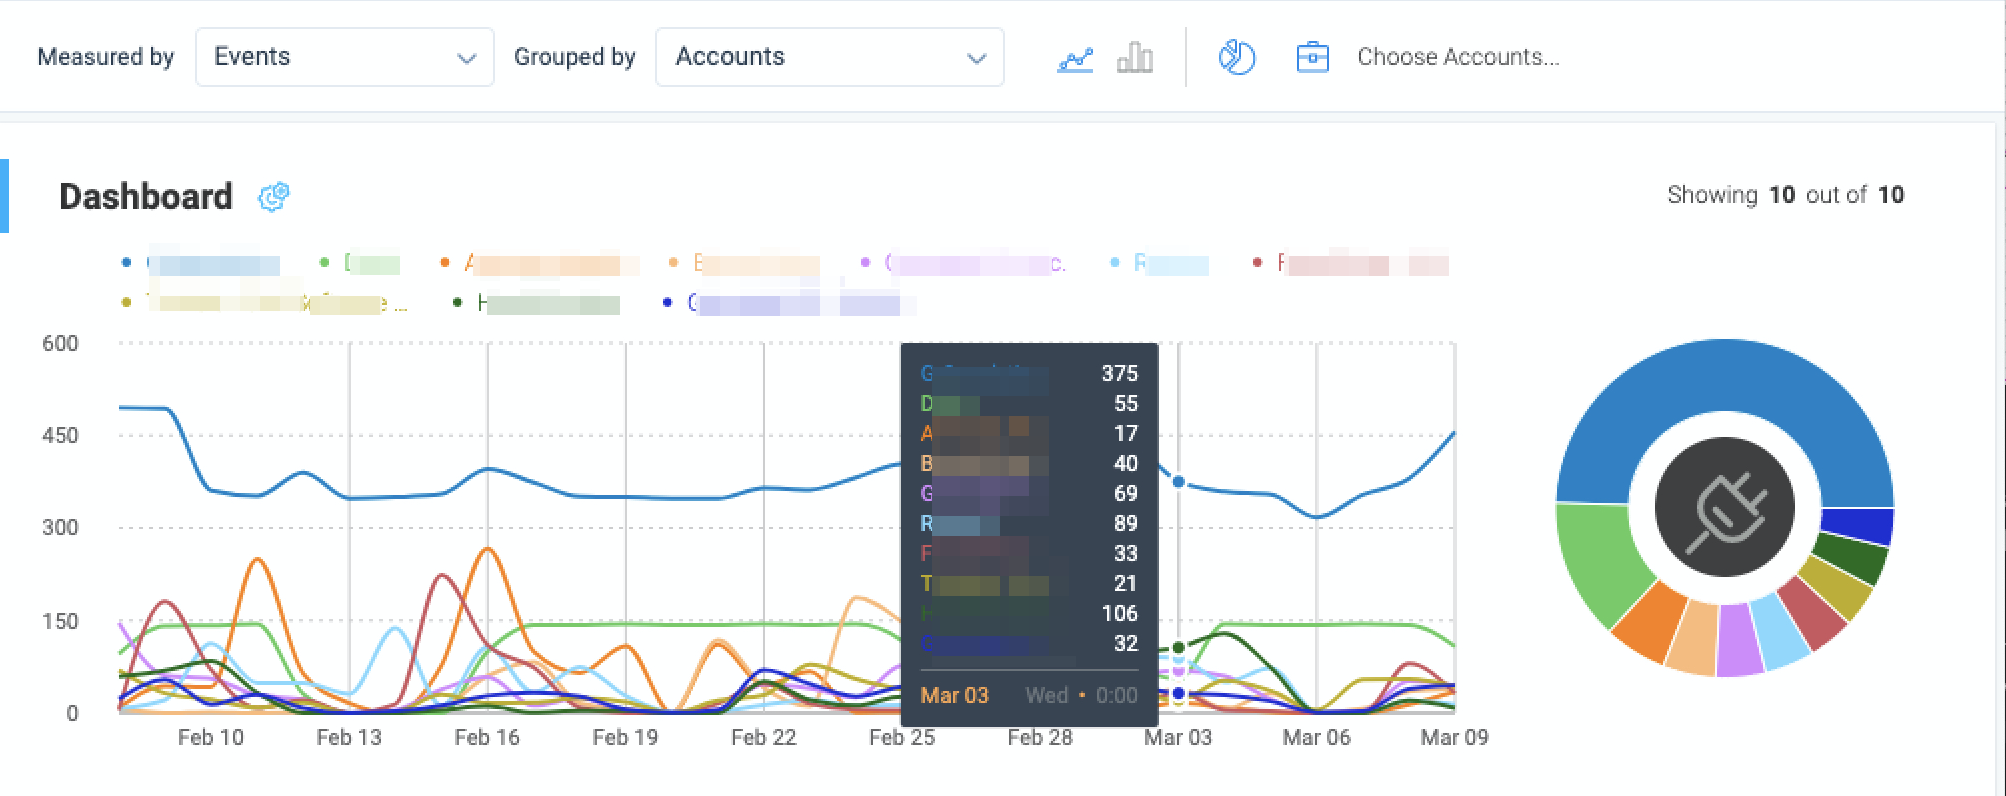
You could also group by “Account” to see the top Accounts.

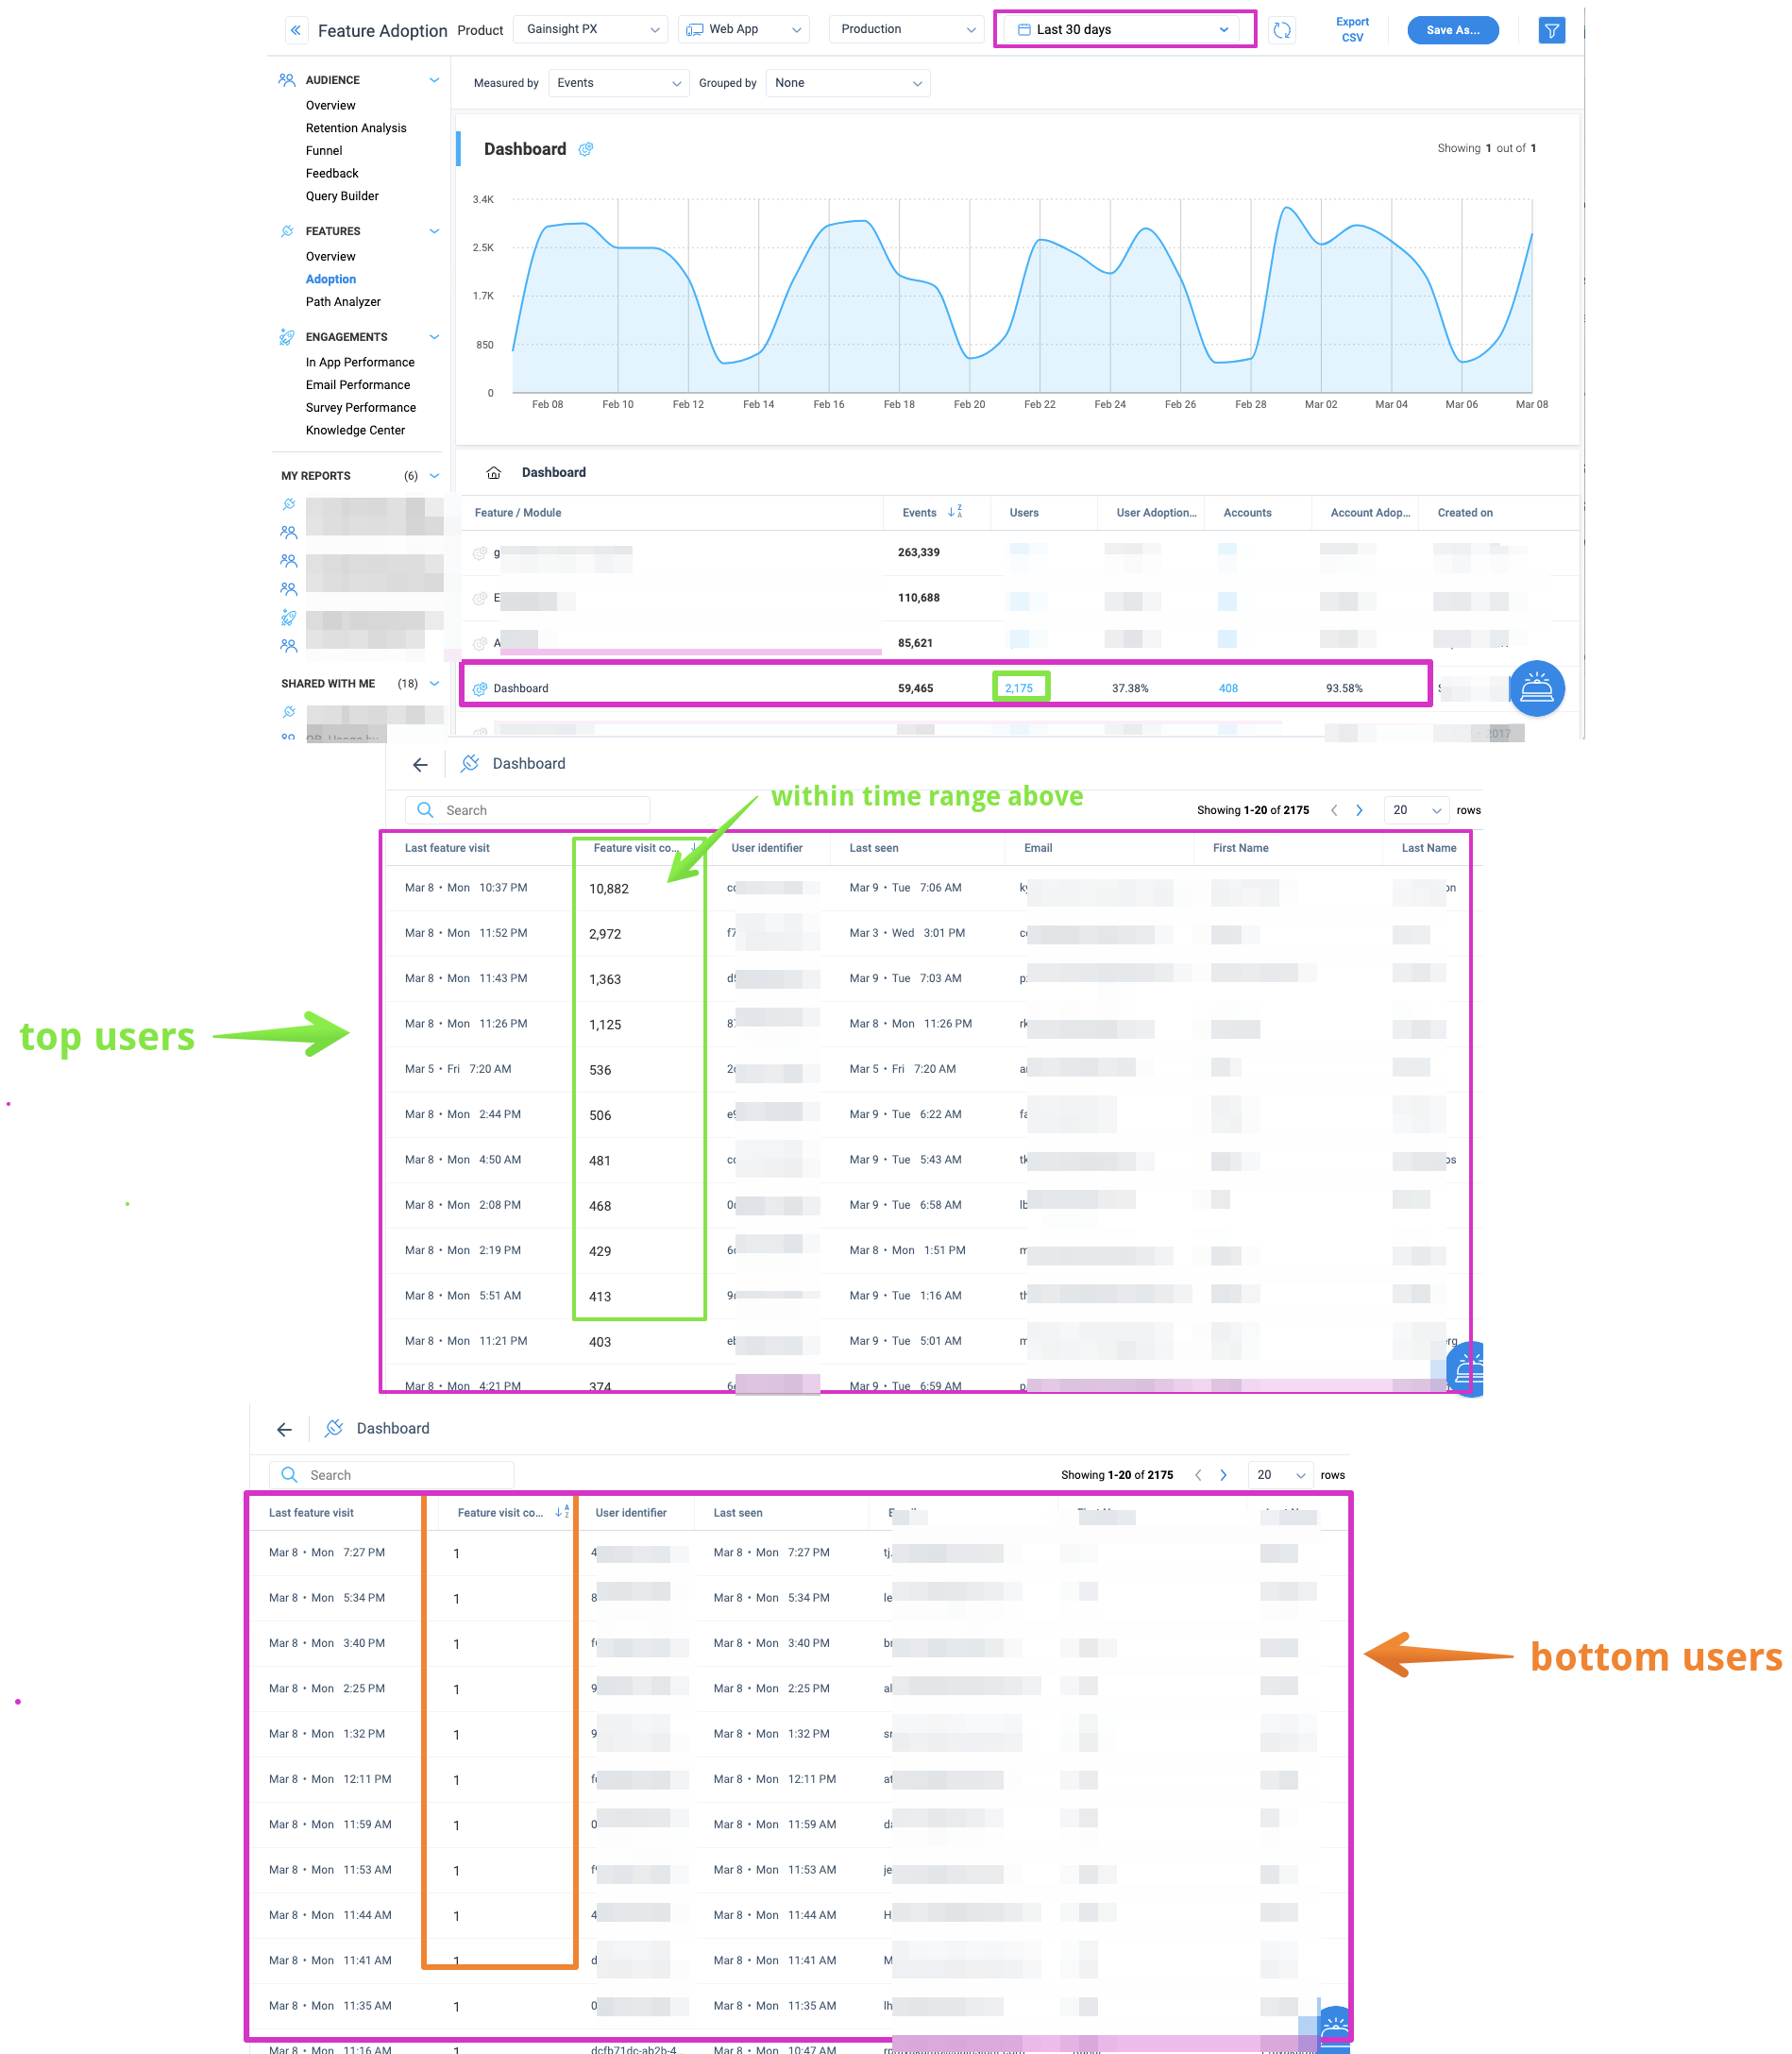
- In the Adoption report, sort by # of Events descending. You can add any filters to exclude certain types of users/accounts too if desired.
- Click on the “Users” column count for the specific feature that you picked in step #1 above. If you are more interested in top/bottom accounts, then click on the “Accounts” column count instead.
- In the resulting user list, sort by “Feature visit count” descending to see the most active users on top. Then again “Feature visit count” ascending to see least active users on the top.
Using our Gainsight PX that tracks our PX users as an example, I picked our PX “Dashboard” as my representative Feature, since that is the landing page for most new PX logins/sessions and a main pillar of PX functionality available to our PX customers. Below are the results in screenshot format…

I hope this helps anyone with similar questions, so please include your comments and other suggestions/idea below.
Happy PX-ing!!!

