Hello, brilliant Product Folks & Customer Success Nerds! Ready to unlock the secrets of your users' behaviour?
If you’ve ever wished for a crystal ball to see exactly how users interact with your product, Gainsight PX is here to grant that wish. Let's dive into the depths of user behavior analytics and discover how to leverage these insights to create an exceptional product experience.

Why Understanding User Behavior Matters?
Understanding user behavior is the cornerstone of effective product management. It helps you:
- Identify User Needs: Pinpoint what users are looking for and how they navigate your product.
- Drive Engagement: Create strategies that resonate with users and keep them coming back.
- Improve Features: Make informed decisions on which features to enhance or retire.
- Boost Retention: Address pain points before they become reasons for churn.
and it’s synonymous to :
When designing a feature, you typically have a hypothesis about the following:
- Problem Solved: What problem the feature will address?
- User Navigation: How the user will navigate through the product to access the feature?
- User Engagement: How the feature will increase user stickiness and engagement with the product?
What you expect while building a feature should reflect in user behaviour , that’s when you could say the feature has enhanced product value.
So , this is how you get started with a basic dashboard setup with few key metrics to track and double down on the user behaviour from there.
Key Metrics to Track
To get a holistic view of user behavior, focus on these key metrics:
- Active Users: Measure daily, weekly, and monthly active users to understand your product's engagement levels.
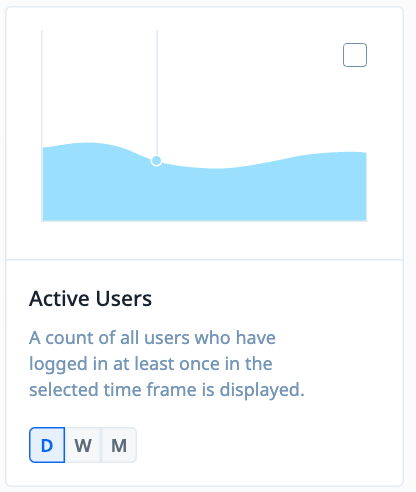
Daily, Weekly, Monthly - Active users - Feature Usage: Identify which features are most and least used to guide your development priorities.
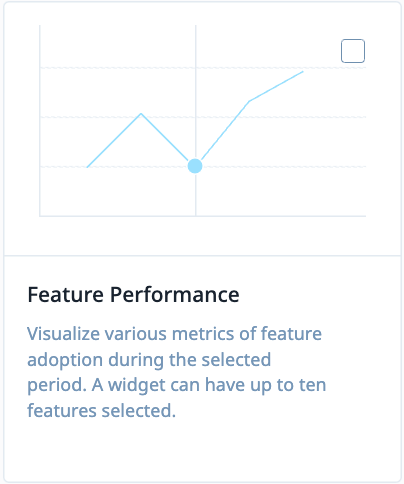
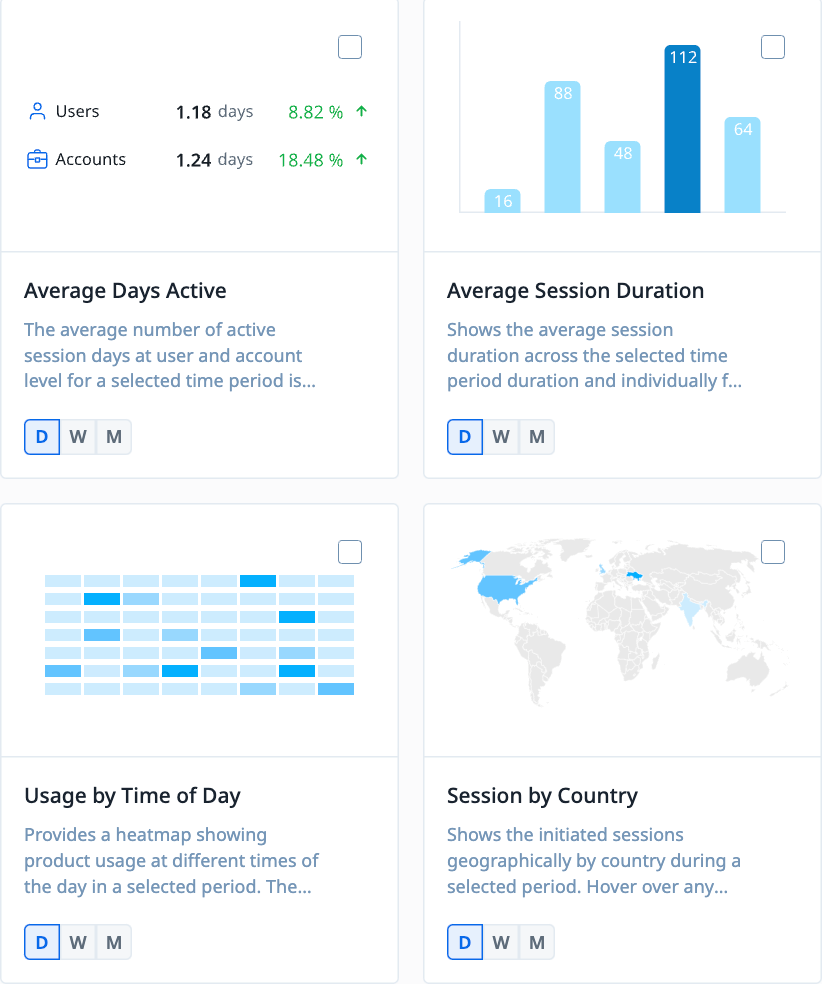
Feature Performance Widget - Session Duration: Analyze how much time users spend on your product during each session.
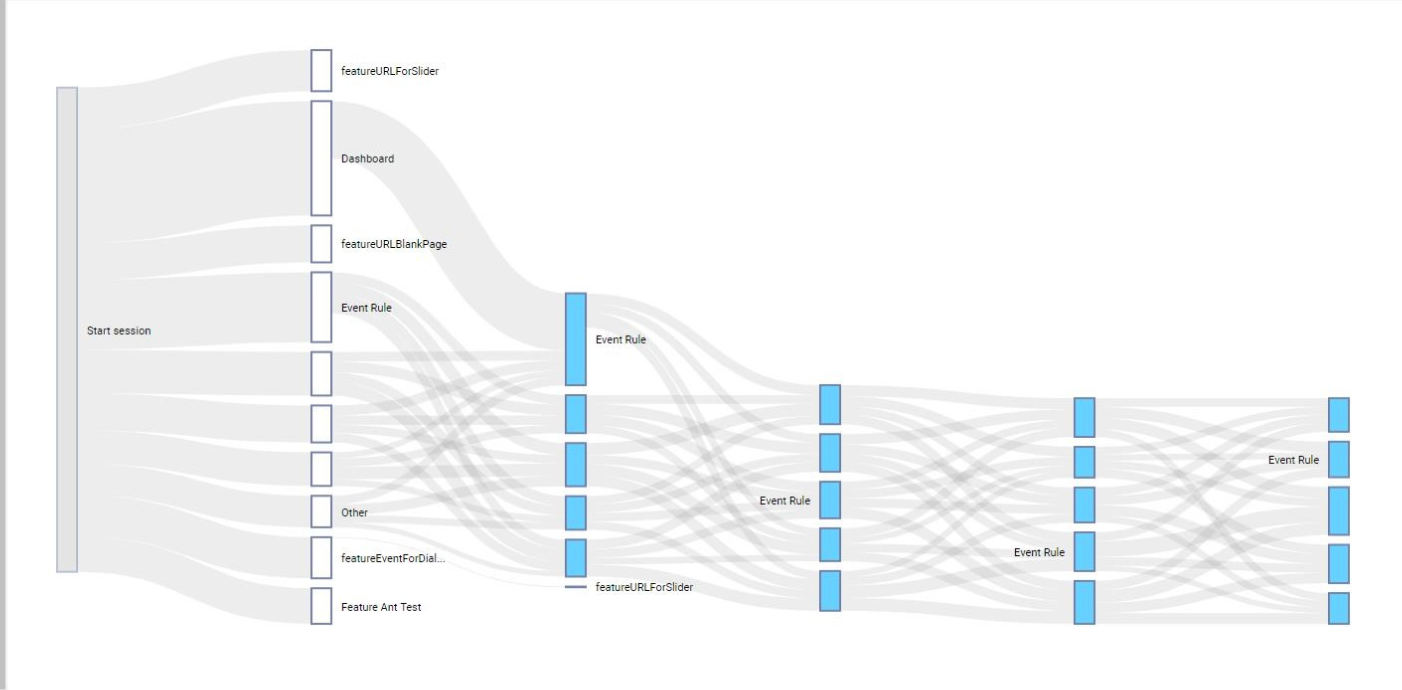
Session Duration - User Pathways: Track the common pathways users take through your product to identify popular routes and potential roadblocks.
Path Analyser - Retention Rates: Monitor how many users return to your product over time.
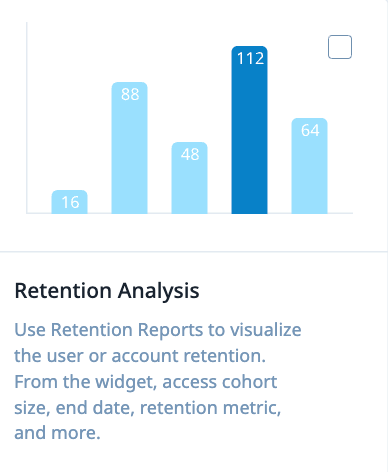
Retention Analysis
With all these widgets, you will be able to answer,
Active users → The Traction!
Feature Performance → How different features are driving adoption of the product?
Session Duration → How healthy is the product usage , that makes the user spend more time on product?
User Pathways → Where the customers are struck ?
Retention rates → Which features are more sticky?
Leveraging Gainsight PX to Understand User Behavior
- Set Up Events & Custom Events: Define key actions you want to track, such as button clicks, form submissions, and page views.
Events or custom events, here is more glimpse into what features matter and how to find that. - Segment Your Users: Use segmentation to categorize users based on behavior, demographics, or other criteria. This helps tailor your analysis and engagement strategies.
- Utilize the Analytics Dashboard: The Gainsight PX dashboard provides a comprehensive view of user interactions. Explore metrics like feature usage, session duration, and user pathways.
- Create User Journeys: Map out typical user journeys to see how users navigate through your product and identify areas for improvement.
- A/B Testing: Implement A/B tests to compare different versions of a feature or interface. Analyze which variant drives better engagement and adoption.
- Collect Feedback: Use in-app surveys and feedback widgets to gather user insights directly. This qualitative data complements your quantitative analytics.
Real-World Example: Improving Feature Adoption
Let's say you’ve launched a new feature, but adoption rates are lower than expected 😔
Here’s how you can use Gainsight PX to turn things around:
- Analyze Feature Usage: Check the analytics dashboard to see how often the feature is being used and by which segments.
→ Are the Enterprise customers using this feature more than the Mid-Market Customers?
- Identify Drop-Off Points: Use user pathways to identify where users are dropping off before engaging with the feature.
→ Why most of the users are dropping of at this point, how do we eliminate friction or enhance user? experience in this page.
- Gather Feedback: Deploy a survey to users who haven’t used the feature to understand why.
→ Understand User sentiment via CES and NPS surveys to get a pulse of the users.
- Optimize Onboarding: Create in-app guides to better introduce the feature to users.
→ Eliminate starting friction by leveraging guided tours for newly released as well as key features of product.
- A/B Testing: Test different onboarding flows or feature placements to see which version drives higher adoption.
→ If you have different engagements designed , test them out for different segments to find which one is resourceful.
- Iterate Based on Data: Use the insights from your tests and feedback to continuously refine the feature and its onboarding process.
→ Listen to your users to iterate on their feedback and get back to them with necessary product enhancements.
If you are getting started with Gainsight Dashboards , here is everything you need to know about every widget out there. The widgets are also categorised into different Dashboard templates and you can pick templates that fits your need and case for user behaviour analysis and add more widgets to the dashboard as you progress.
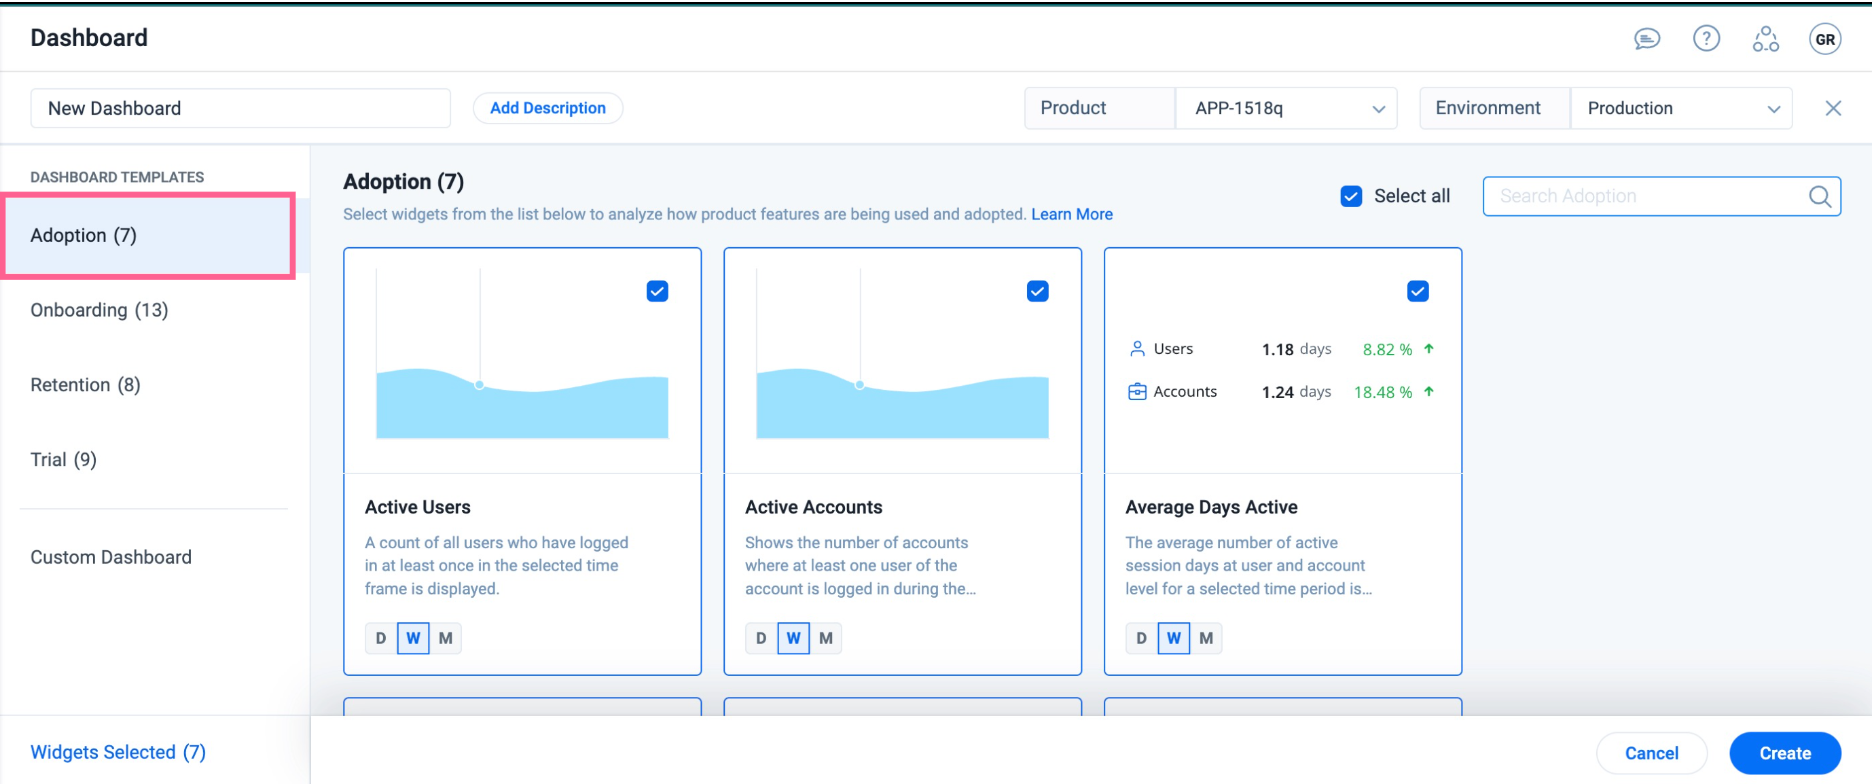
Get started here : Dashboard Templates
So..
Understanding user behavior is like having a roadmap to your product’s success. With Gainsight PX, you can dive deep into how users interact with your product, identify areas for improvement, and drive engagement and satisfaction. Stay tuned for more insights and best practices to take your product management & CS Management skills to the next level!

