


Gainsight PX: Build Custom Metrics with the Enhanced Query Builder
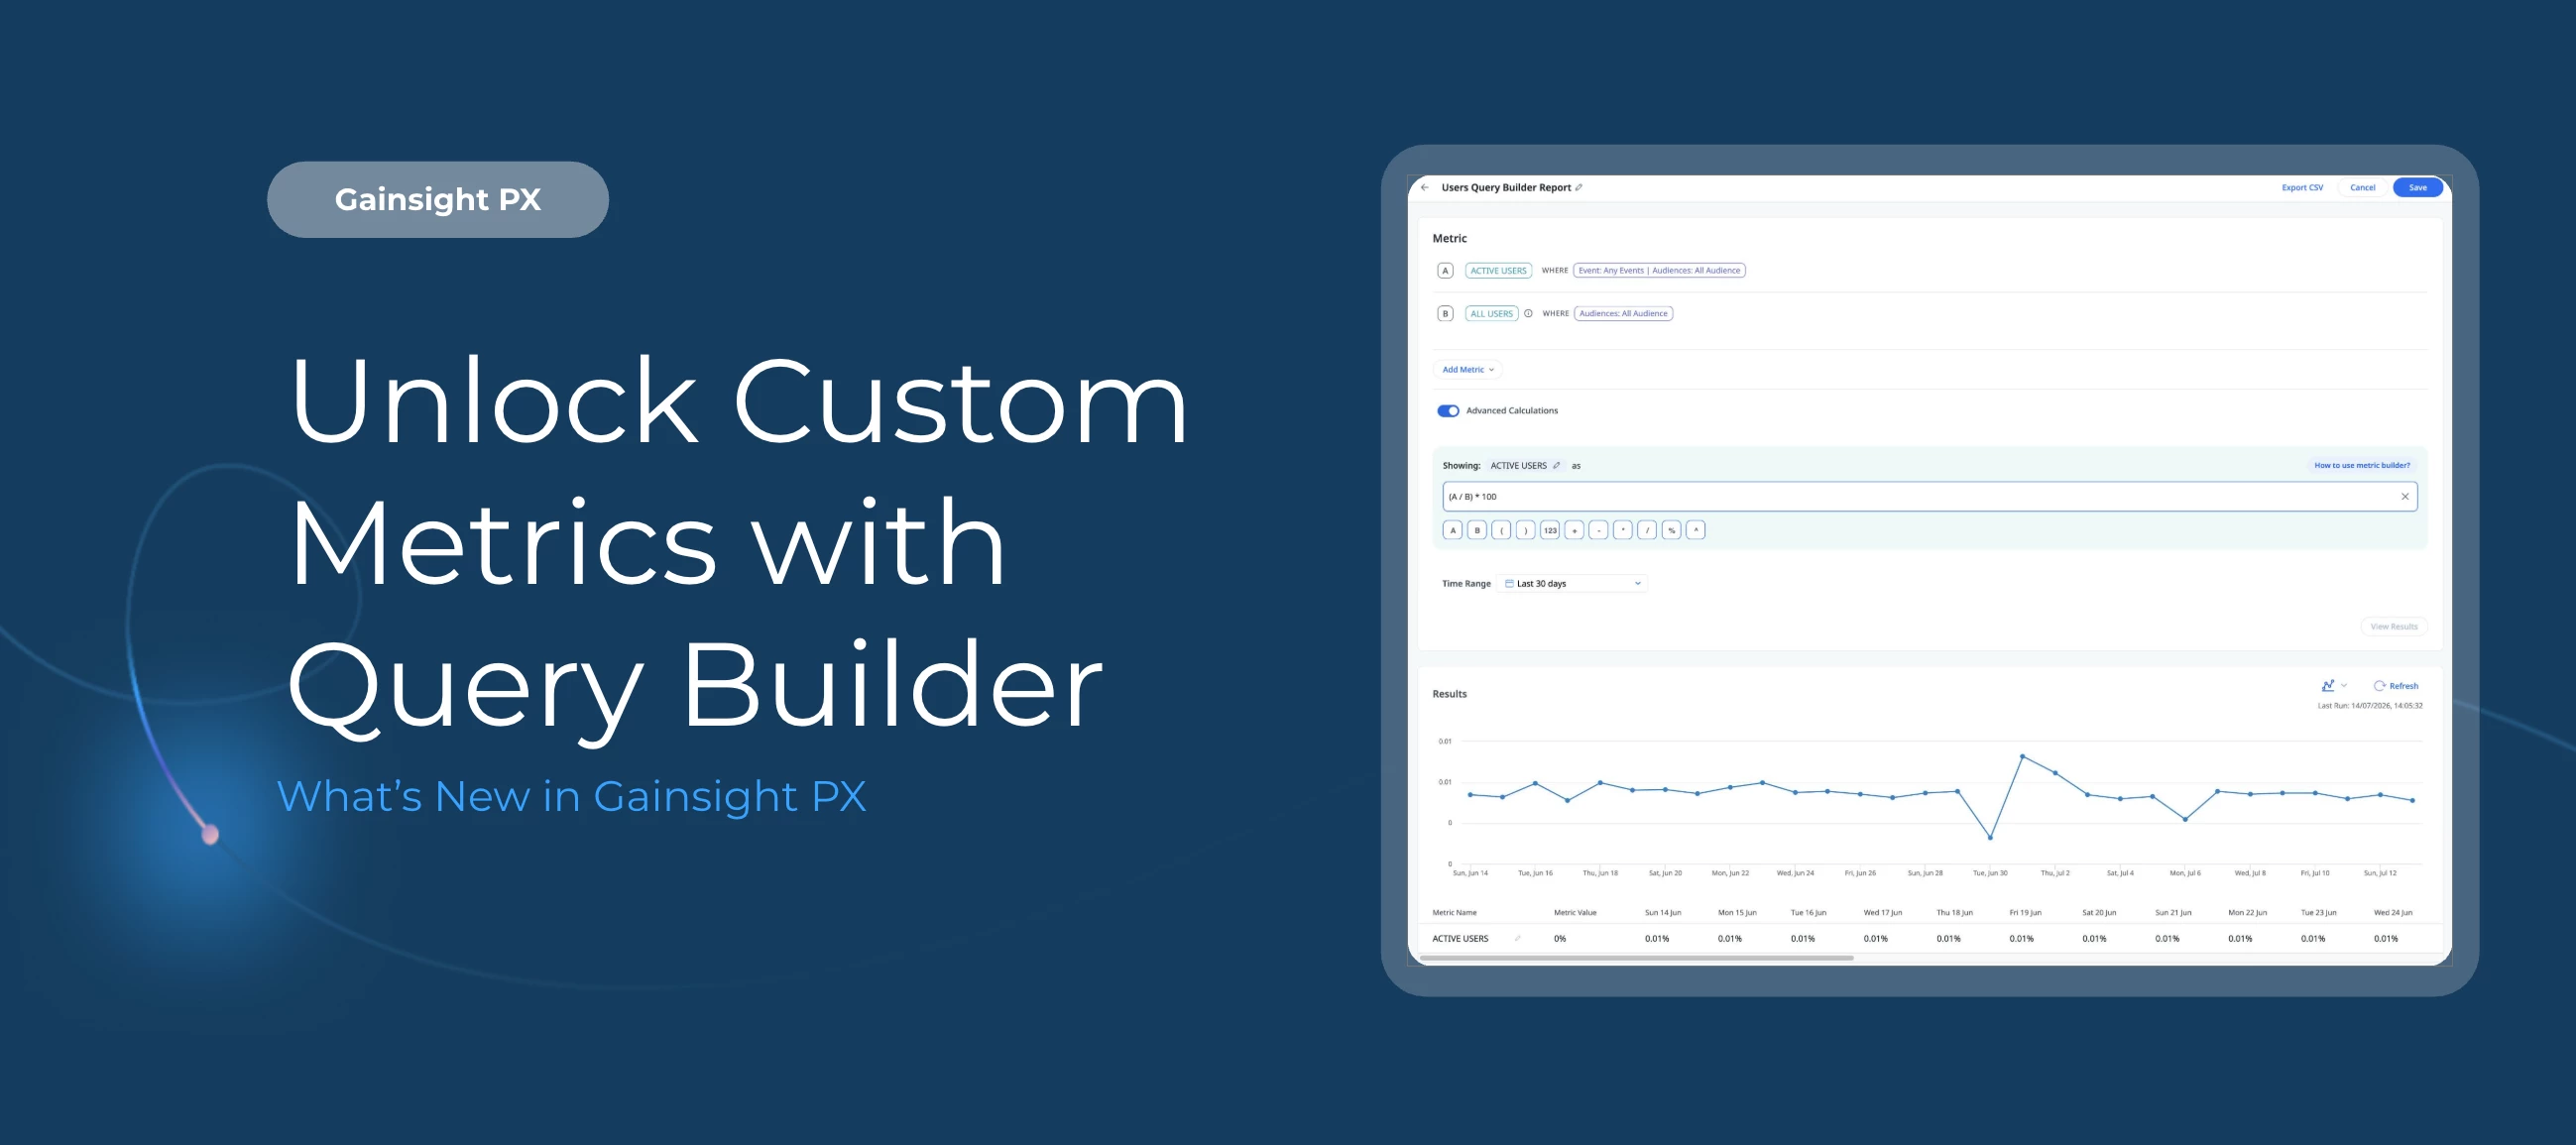
This release brings updates to Query Builder, Path Analyzer, and Badge Icon engagements. Query Builder now goes beyond cohort analysis, letting you define custom metrics and apply formula-based calculations directly in PX without exporting data to an external tool. Path Analyzer adds two new time-based metrics to help you understand how long users take to move through a path. And Badge icon engagements now support displaying custom images in their original shape and aspect ratio.
Here’s What’s New
Query Builder
A new Metrics experience alongside the classic Cohort view
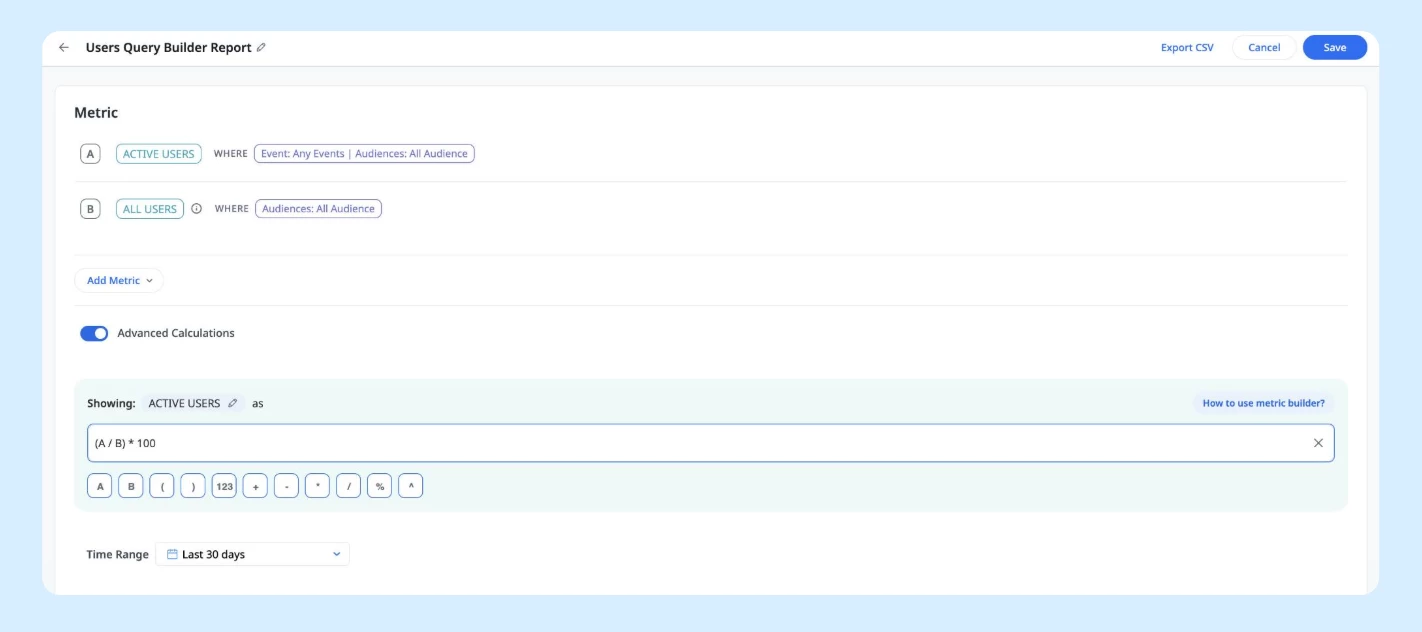
Query Builder now includes two modes: the new Metrics experience and the existing Cohort view. Switch between them depending on the analysis you need. Both are accessible from the same place.
Pre-built PX metrics for fast reporting
Select from a library of standard metrics such as new users, active users , total events and more to build reports quickly without starting from scratch.
Custom metrics using aggregate functions and filters
Define your own metrics using Sum, Average, Count, and other aggregation functions applied to user attributes, account attributes, or custom event properties. Refine any metric further using filters on events, user attributes, account attributes, and custom event properties to zero in on exactly the data that matters.
Formula builder for combined metrics
Combine multiple metrics using standard mathematical operators (+, -, *, /, %, ^, and parentheses) to create aggregate metrics that reflect your specific business needs.
Easy to read query format
Queries are now presented in a structured, readable format so it's easier to understand and validate what you've built, especially for complex calculations.
View results directly in dashboards
Computed metric values are available for use in dashboard widgets, so your analysis is always just a few clicks away from your reporting views.
Path Analyzer
See how long users take to move through a path
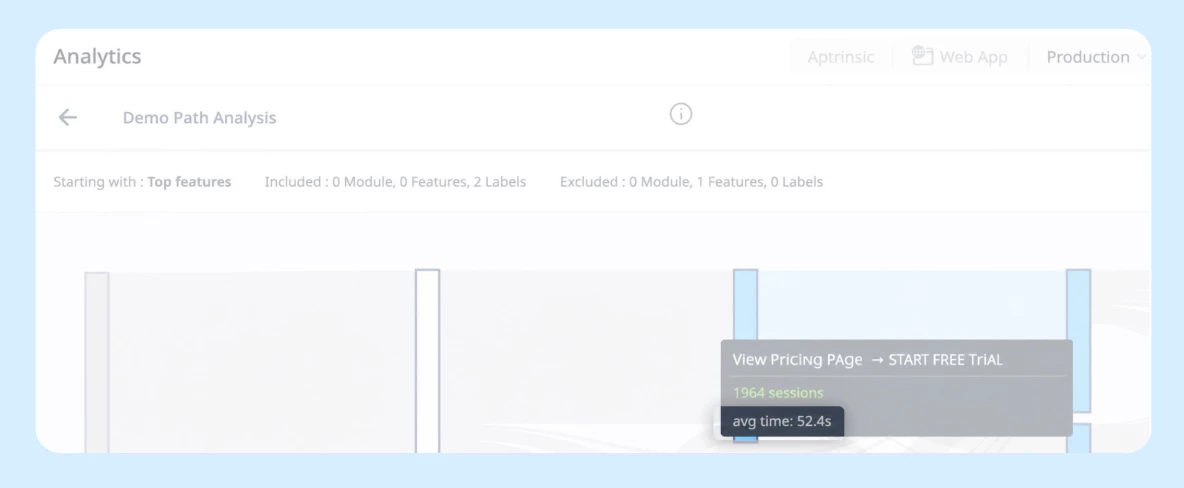
Path Analyzer now shows two new time-based metrics to help you understand user progression. Hover over the connection between two nodes to see the average time users take to move between steps. Hover over any node to see the average time users take to reach that step from the previous node.
Badge Icon Shapes
Display badge icons in their original shape
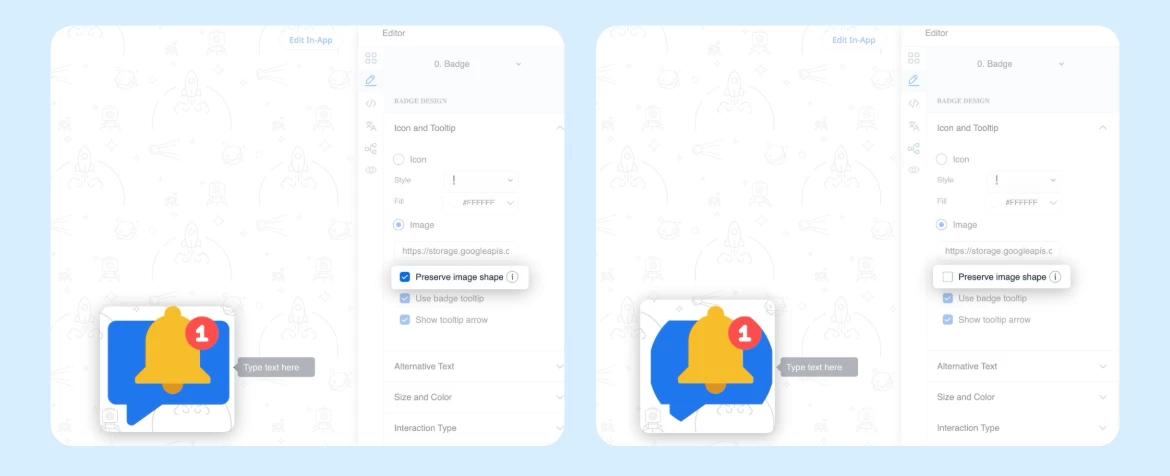
The Badge icon trigger type now supports displaying custom images in their original shape and aspect ratio, instead of cropping them to a circle. Enable the Preserve image shape setting on any badge engagement to maintain the original shape. New engagements have this setting on by default; existing engagements retain their current behavior.
Getting Started
The enhanced Query Builder is available in your PX account now. Open Query Builder and select the Metrics option while creating a report to get started. The existing Cohort experience remains accessible from the same view. Path Analyzer time metrics are available on any existing path report with no additional configuration. Badge icon shape settings are available in the engagement editor under the Badge trigger settings.
👉 Check out the Release Notes for more details.
💬 Have a question for our team? Drop a comment below!