

daniel.boon
Helper ⭐️⭐️⭐️
August 24, 2020
Beta Release

Improved dashboards now available (+ find out when current dashboards will be replaced)
Related products:CC Analytics & Reporting
  • August 24, 2020
  • 15 replies
  • 490 views
Improved dashboards now available (+ find out when current dashboards will be replaced)

We’ve released brand-new & improved dashboards in public beta for all community managers and admins.

Here’s a quick summary of what you need to know:

  • We’ve rebuilt the Content, User, and Success dashboards with an improved user experience.
  • We aim to completely replace the old dashboards with the new dashboards by Wednesday 23 September 2020, so we’d really like your feedback to understand whether the rebuilt dashboards work well for you. Until then the old dashboards and the new dashboards will be available side by side in Control (the new dashboards have a blue ‘BETA’ label next to them in the menu).
  • The metrics visualised on the new dashboards are mostly the same as on the old dashboards, with a few key differences (check out the ‘Key differences’ section below for more details).

Why are the dashboards being rebuilt and replaced?

  • We heard feedback from many of you that the current dashboards had an unintuitive user experience, especially when it came to filtering. Now, the filters are conveniently available at the top of each dashboard 🙌.
  • We also saw that on larger communities, the dashboards sometimes took an exceptionally long time to load. Now, they’re a lot speedier ⚡️!
  • By changing the underlying technology powering the dashboards, we’re also in a better position to iterate on your feedback / requests for new metrics much faster than before 🏃‍♂️.

Key differences between the old dashboards and the improved dashboards


Here’s a quick summary of the key differences between the old dashboards and the improved dashboards, focusing on the elements that we do not currently plan to rebuild (highlighted in the blue callouts).

For more information, read our detailed guide to changes on the new dashboards.

Content dashboard
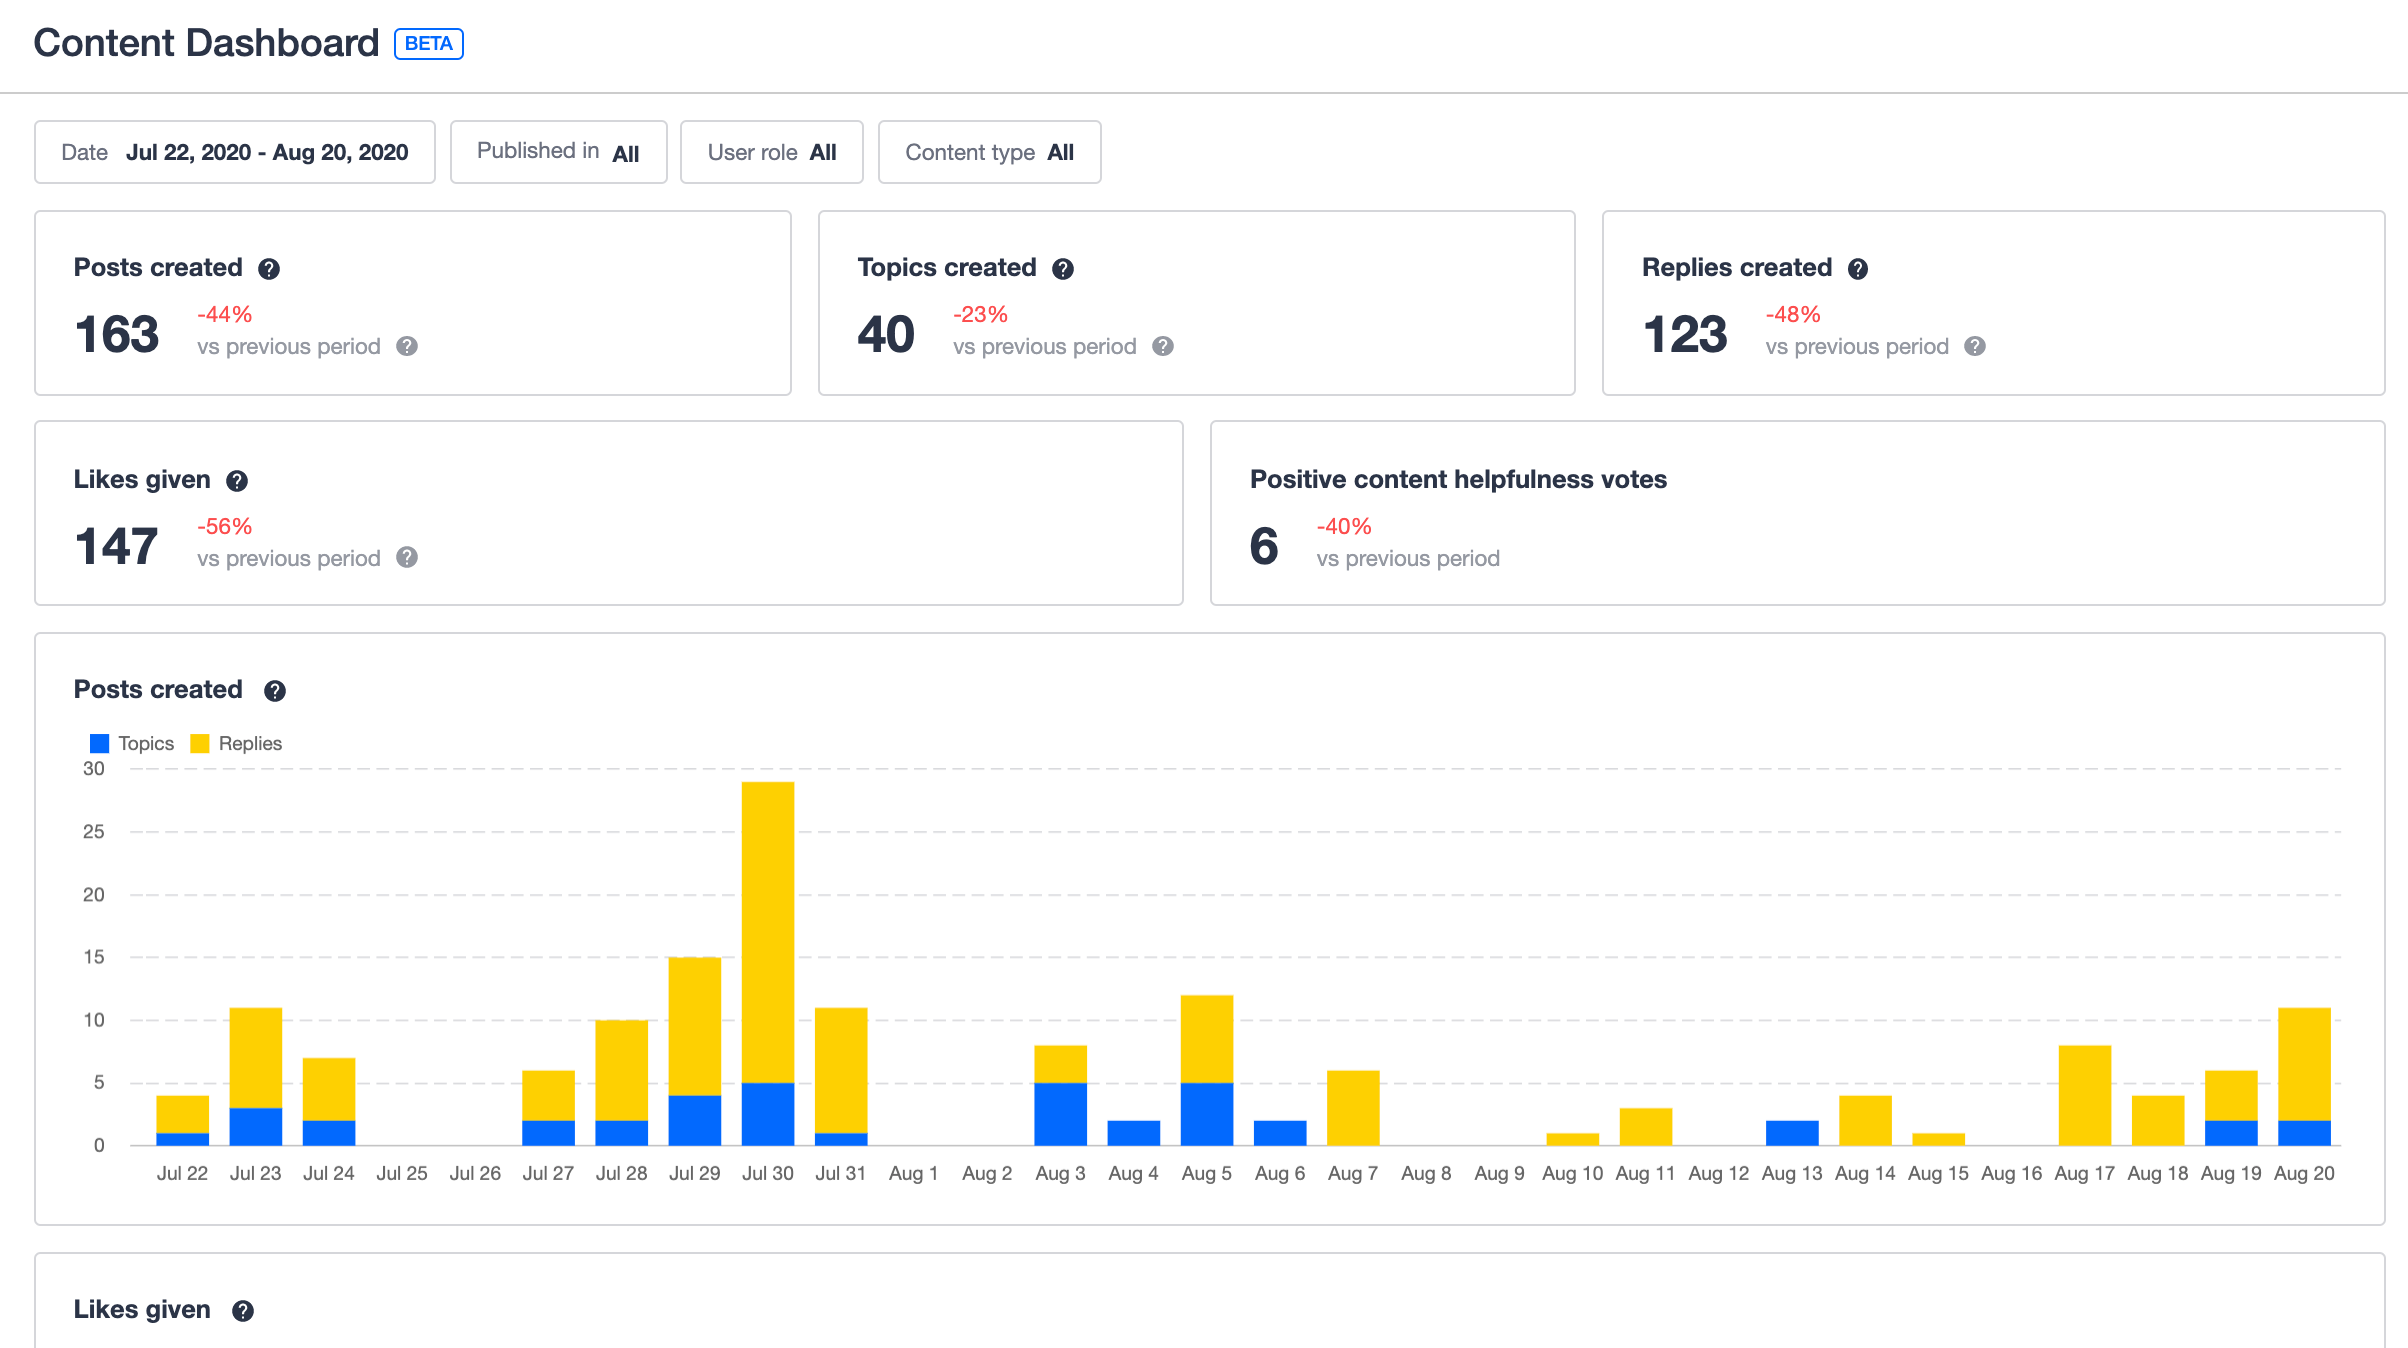
The improved Content Dashboard (not pictured: likes given over time chart, topics created per user role/content type charts, and popular topics/popular categories tables).

Widgets that we do not currently plan to rebuild on the new Content Dashboard:

  • Detailed topic/category table views

User dashboard
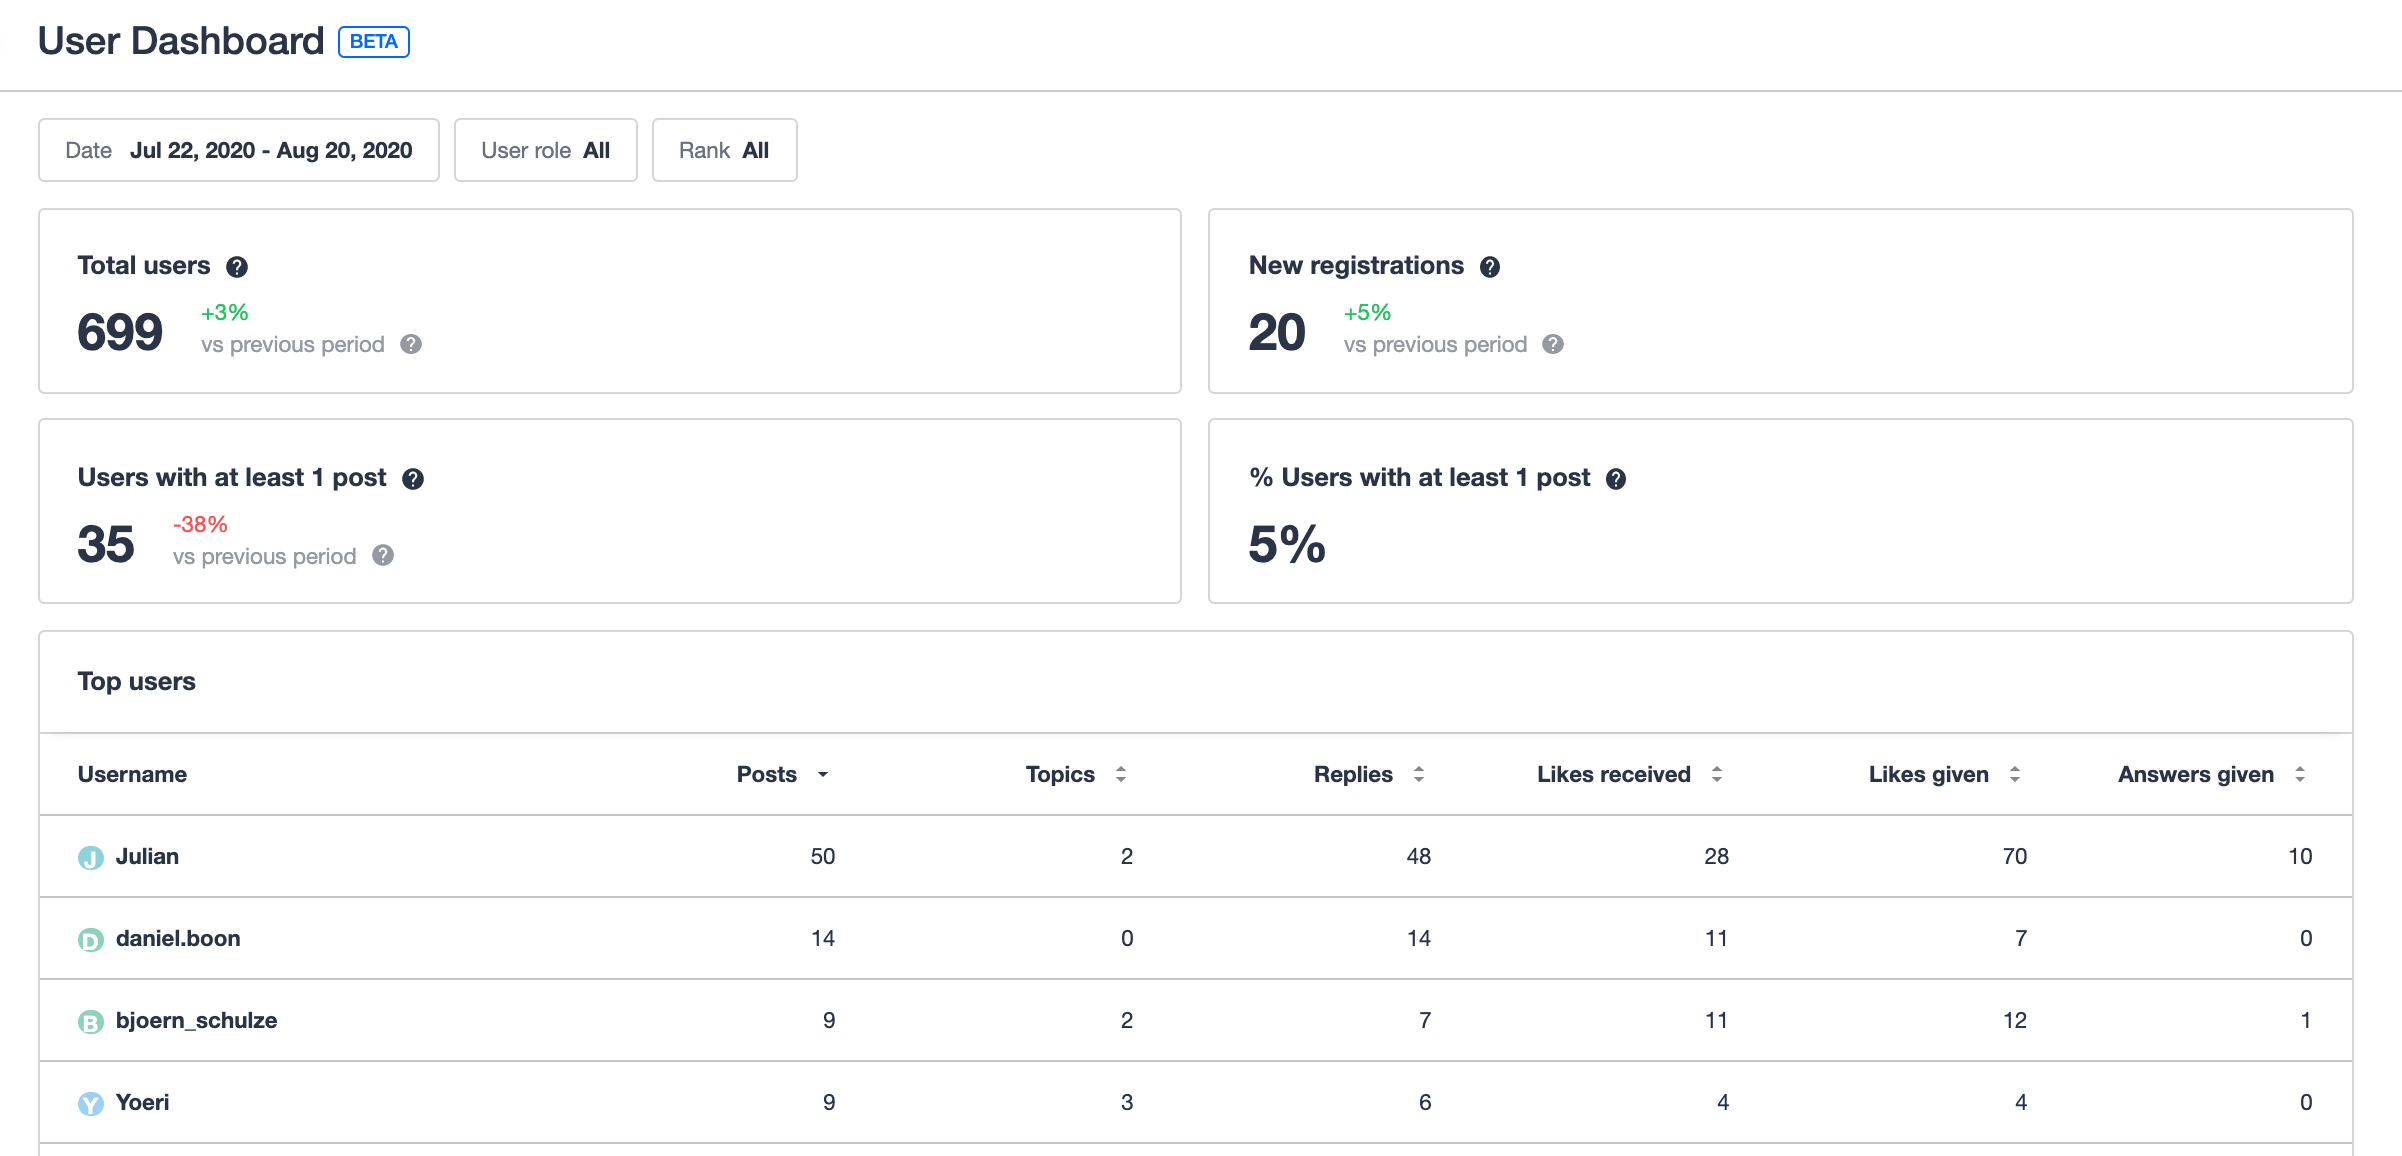
Widgets that we do not currently plan to rebuild on the new User Dashboard:

  • Rank changes
  • Activated accounts
  • Ranks table and detailed ranks table view.


Success dashboard
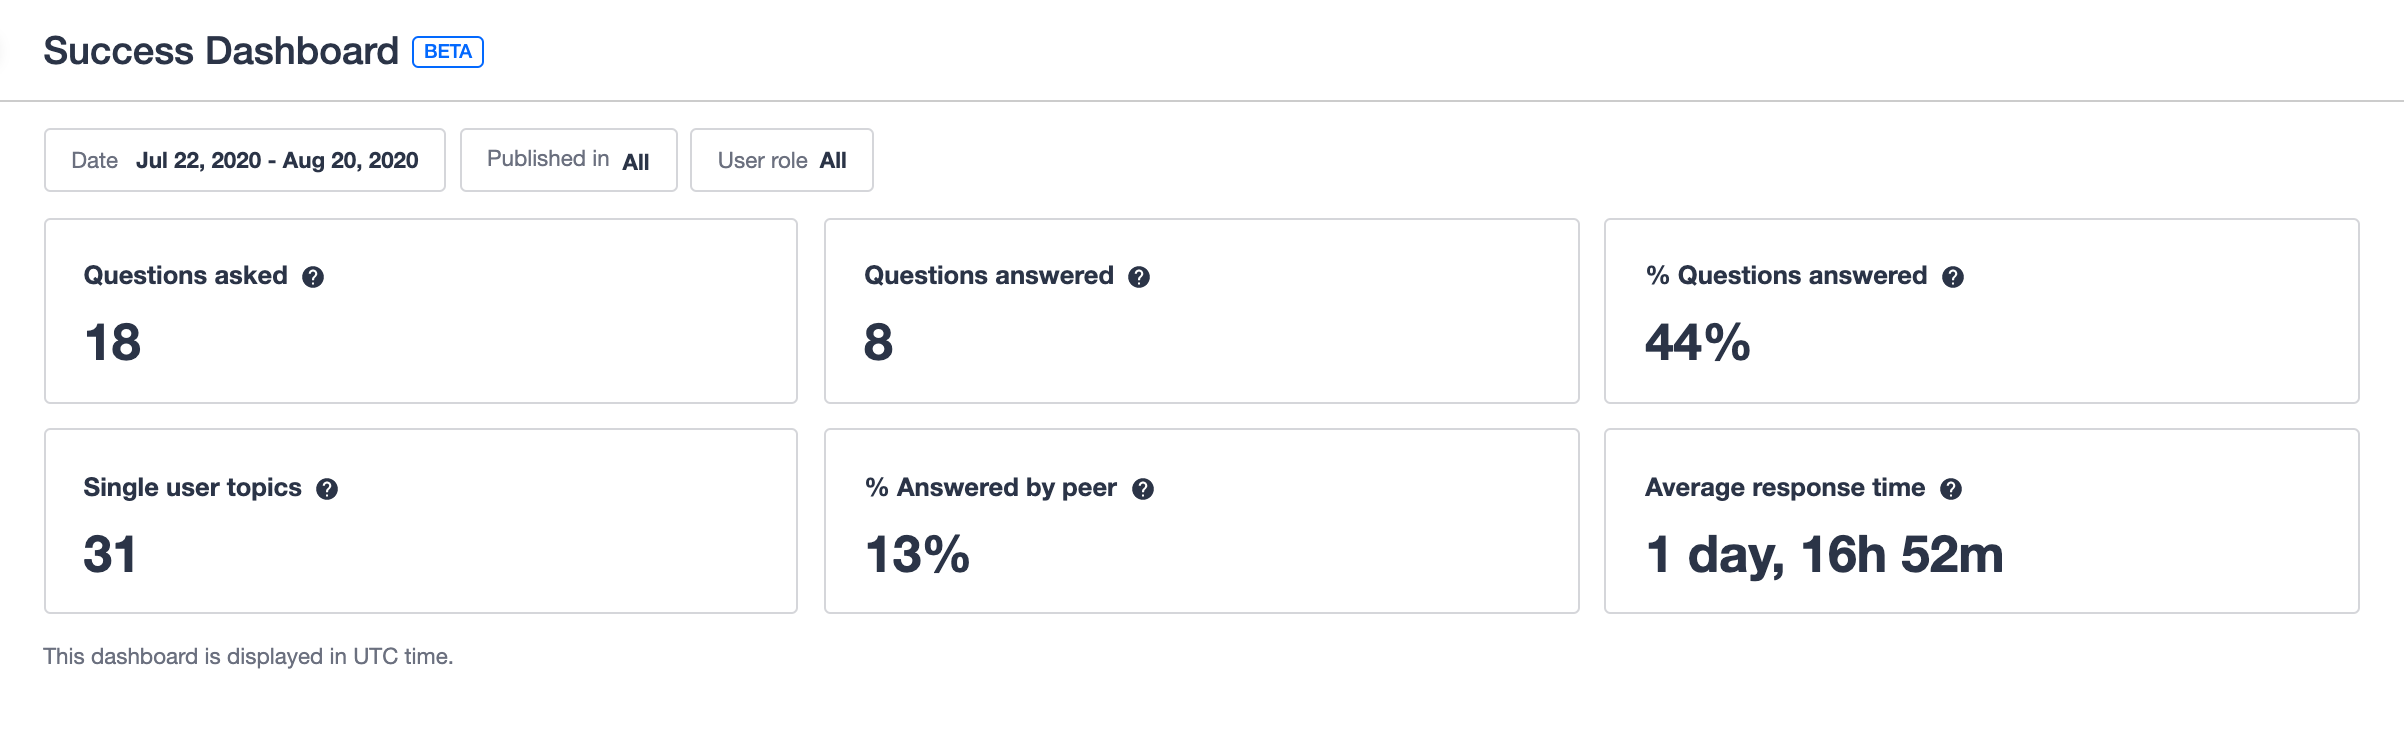
Widgets that we do not currently plan to rebuild on the new Success Dashboard:

  • Marked answers
  • Active users per topic created
  • Avg. replies per topic
  • Number of replies per topic
  • All-time activation funnel.

Known bugs (to be resolved) 🐛

  • ✅Fixed: When filtering on ‘Published in’, choosing a ‘reported posts category’ can cause the results to become inaccurate (i.e. the category that stores reports of when end users have ‘flagged’ content). 

Let us know what you think


A great big thank you to all the customers who gave us early feedback in the private beta of the improved dashboards: @Kgastaldo @m4rc @Suvi Lehtovaara @koles @stanislav.fedoseev @Marina Perminova @lila_meyer @James Scott @Kasper86 @Rudi @Hendrik Jan 

We’re excited to hear what you think of the improved dashboards. We know a lot of you are actively using the current dashboards, and we want to make the transition period as effortless as possible for you. Please reply with your feedback, especially if:

  • You encounter unexpected behaviour
  • There’s anything you’re really missing from the old dashboards.
  • You already prefer the new dashboards! (we’d love to hear what you like, as well as what else you’d like to see improved in the future).

15 replies

daniel.boon
Helper ⭐️⭐️⭐️
September 16, 2020

Thanks for sharing your feedback @Suvi Lehtovaara @Annina @Manna K! :)

Makes sense that you want to avoid disrupting moderation in Control when going over reports - cc @xiaoyu-shen

inSided product alumnus
Casstastr0phee
Contributor ⭐️⭐️⭐️⭐️⭐️
January 8, 2021

Not sure if this is the right place to ask this, or if I should just create a new topic…
Wondering though, if the % Answered by Peer takes into account any custom roles? For instance, in my account, it says “56.28% Answered by Peer” and that “the % of answers where the author of the best answer has the registered user or superuser role” - but does this take into account if its a registered user and a partner? 

Essentially, I wanted to see if there was a way to measure out of all the questions asked, how many were answered by employees, how many were answered by partners, and how many were by actual peers, but it doesn’t seem to compute that accurately (or perhaps I’m not filtering it correctly). Any insight on tips on this would be greatly appreciated! 

I follow Julian's nose, it always knows
daniel.boon
Helper ⭐️⭐️⭐️
January 11, 2021

Not sure if this is the right place to ask this, or if I should just create a new topic…
Wondering though, if the % Answered by Peer takes into account any custom roles? For instance, in my account, it says “56.28% Answered by Peer” and that “the % of answers where the author of the best answer has the registered user or superuser role” - but does this take into account if its a registered user and a partner? 

Essentially, I wanted to see if there was a way to measure out of all the questions asked, how many were answered by employees, how many were answered by partners, and how many were by actual peers, but it doesn’t seem to compute that accurately (or perhaps I’m not filtering it correctly). Any insight on tips on this would be greatly appreciated! 

Hey @Casstastr0phee thanks for the question!

When filtering by user roles on the success dashboard, this narrows down the % answered by peer metric according to the role of the user who asked the question, rather than the author of the answer.

In addition, by default (with no filters applied), answered by peer does not take into account custom user roles, so unfortunately it’s not possible via the dashboard to segment the metric based on employee vs partner vs actual peers right now in this way.

It’s something we’ve considered, so I’d highly recommend submitting an idea so that others can chip in too :) !

inSided product alumnus
Kgastaldo
Helper ⭐️⭐️⭐️
January 12, 2021


Essentially, I wanted to see if there was a way to measure out of all the questions asked, how many were answered by employees, how many were answered by partners, and how many were by actual peers, but it doesn’t seem to compute that accurately (or perhaps I’m not filtering it correctly). Any insight on tips on this would be greatly appreciated! 


I need exactly the same thing - and am using custom roles to separate these groups. Did you create an idea for this? I’ll happily cast my vote if so!

Casstastr0phee
Contributor ⭐️⭐️⭐️⭐️⭐️
January 18, 2021

@Kgastaldo sorry for the delay! Yes I created this idea and would love if folks upvoted this particular feature. Of course, I’m no engineer so I have no clue how it works, but it seems like given users already have these custom roles appended to their account, perhaps its not an insanely huge lift for the team? I think this will really help Community Managers identify areas of opportunity to focus on main contributors, and leverage different programs to help facilitate better and more meaningful conversations. For example, if I know that Employees are answering 15% more questions than Partners, perhaps I need to lean on my teams Partner Programs to ensure that they are being educated on how to participate in the Community, or to create more incentives for them to get active, which reduces the level of employee participation. Overall, the ideal is to see more peer to peer education, so I’d like to at least see that breakdown. 

Thanks everyone! 
-Cass. 
Link to Idea - Improved Success Dashboards: Filtering by Roles

I follow Julian's nose, it always knows