Solved

CASE or IF Statements in Report Formula Fields

  • April 16, 2024
  • 3 replies
  • 150 views

  • Contributor ⭐️
  • 2 replies

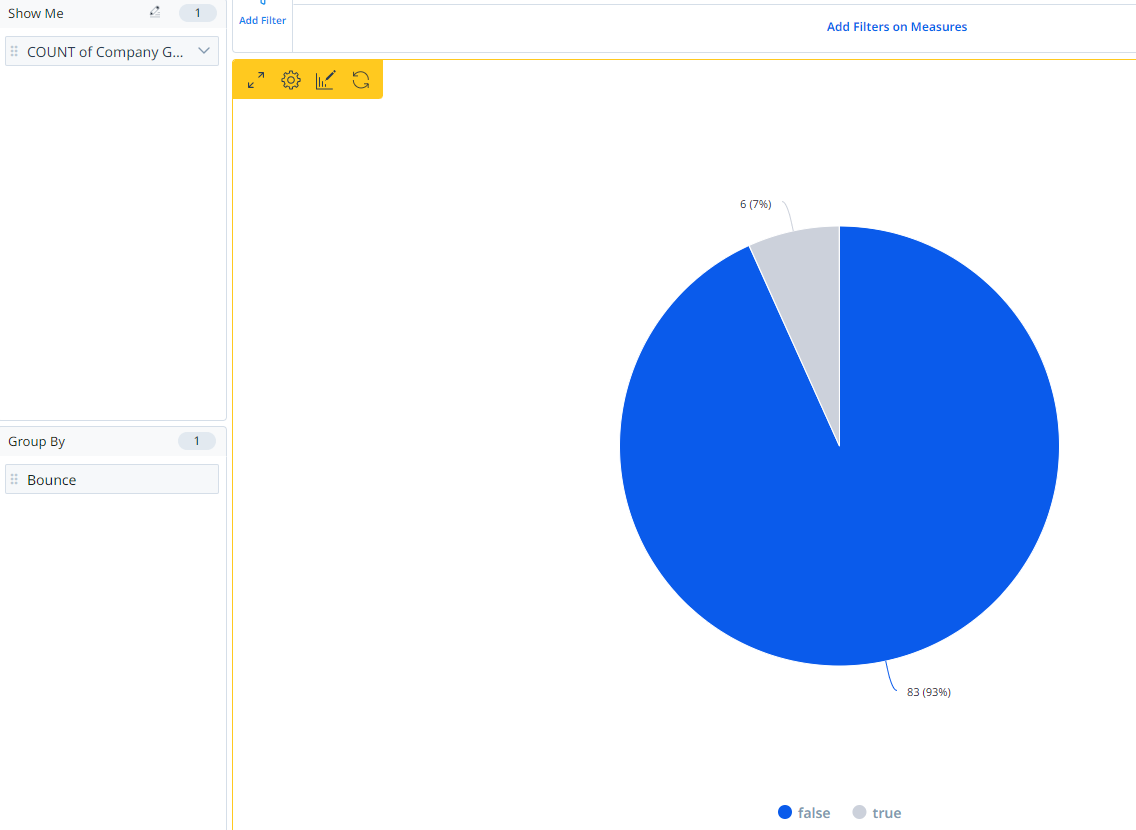
I’m trying to build a dashboard that calculates what % of our delivered emails were marked as SPAM. This is critical for ensuring the deliverability of our emails and success of our programs. 

I noticed that the values for the AO Email - Spam field are Yes and No. Typically in reporting tools Yes = 1 and No = 0, so you can do a formula field that counts the number of records marked as “Yes”. In Gainsight reports, Yes and No do not seem to correspond to number values. 

The workaround would be to write a formula using either ‘CASE WHEN’ or ‘IF’ statements. However, Gainsight does not support that either. For example:

  •  CASE WHEN SPAM = Yes THEN 1 ELSE 0
  • IF(CASE = Yes, 1, 0)

Best answer by romihache

Hi @tfriss !
I’m not sure I understood the question, but you can count by any other value.
This is a random report using a Boolean and a pie chart


You can also configure the aliases as needed


If your use case is more complex, you can use case statements in Data Designer
Hope this helps,

View original
Did you find this topic helpful?

3 replies

romihache
Forum|alt.badge.img+8
  • VIP ⭐️⭐️⭐️⭐️⭐️
  • 420 replies
  • Answer
  • April 16, 2024

Hi @tfriss !
I’m not sure I understood the question, but you can count by any other value.
This is a random report using a Boolean and a pie chart


You can also configure the aliases as needed


If your use case is more complex, you can use case statements in Data Designer
Hope this helps,


balajibv
  • Contributor ⭐️⭐️⭐️
  • 10 replies
  • June 18, 2024

I can share a proper use case for this change in Formula Field.

I need to show a distribution chart of Compliance value which 0-100 and some going above 100+. My typical buckets are

0-40, 40-60, 60-80, 80-100, 100+

Unfortunately current formula field doesnt give an option, other than tinker with Data Designer


  • Author
  • Contributor ⭐️
  • 2 replies
  • July 29, 2024

This is a helpful solution! Here’s one use case I’m looking to resolve that this doesn’t solve for thought...showing % of emails that were marked as spam over time. I could use a segmented bar chart or data designer for this, but it would be nice to have it be built into the reporting features and just show the % SPAM . 


Reply


Cookie policy

We use cookies to enhance and personalize your experience. If you accept you agree to our full cookie policy. Learn more about our cookies.

 
Cookie settings