Question

Axis Doesn't Match When Using Two Similar Data Points

  • February 22, 2018
  • 2 replies
  • 29 views

steve_davis
Forum|alt.badge.img+2
This report (see screenshot) is very confusing because the two axis don't match up. In scenarios where these values range drastically (i.e. one axis is values like 10 while the other has values in the thousands) I understand why it behaves this way, however when the data values are smilier the axis scaling should be the same. What I'd like to do with this report is to at a glance tell if a customer is over their 90 day rolling average. As you can see below its very misleading because one graph is scaled slightly different to the other even though the values only vary by just a few single numbers. This makes me think an account is under when in reality they are over what they should be. 

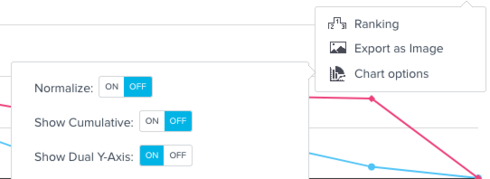
Update: you can turn off the "Dual Y Axis" in the Chart Options. This really solves the pain point here, because you can turn it on for large variances and off for reports like mine. Screenshot attached in how to turn this off. 


2 replies

dan_ahrens
Forum|alt.badge.img+2
  • Expert ⭐️⭐️⭐️
  • 1984 replies
  • March 5, 2018
Hey Steve, are you able to turn off the Dual Y axis option on that report?


steve_davis
Forum|alt.badge.img+2
  • Author
  • Gainsight Employee ⭐️⭐️
  • 201 replies
  • March 5, 2018
Dan Aherns for the win ladies and gentlemen!! I will leave this post up and switch it over to a "question" and "answered" status so product doesn't review. 

Reply


Cookie policy

We use cookies to enhance and personalize your experience. If you accept you agree to our full cookie policy. Learn more about our cookies.

 
Cookie settings