Hi Community! Hoping someone has a creative solution to a problem we've been trying to solve for months.
We have an overall account health rating/scorecard that writes the score (red, yellow, or green) to a salesforce object once a week. I've been able to make a GS report that shows accounts that have been red for over 60 days by looking for the occurrence of a red score for 8+ weeks in a row. However, we really need a trend report to see how many red accounts we have week-to-week. I've tried what feels like every possible combination of SUM and COUNT fields, but I can't figure out how to 1) get the sum of red accounts for a week and 2) store it so we can have trend reporting (I want a trend line in a dashboard, ultimately). Any thoughts? I'm willing to rebuild a lot of this if needed, so any ideas are helpful!
Solved
Scorecard Status Counting/Suming
Best answer by rbegley
Aditya,
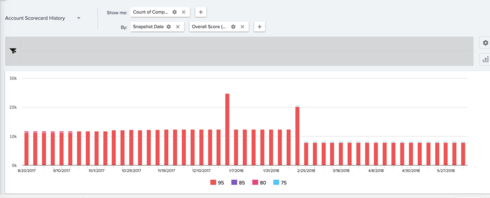
My experience with the Scorecard History object is that it only snapshots the number value (even if you are on a color scoring scheme) and so the report you show in your document doesn't visually look like that when you apply those report settings. When on a RYG system, it will snapshot the midpoint of the range.
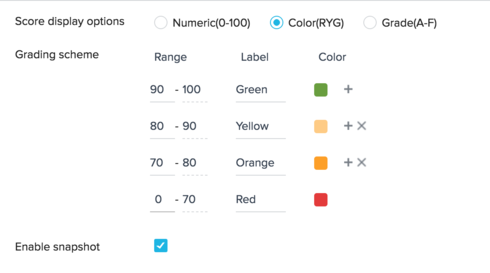
Notice 95, 85, 80, 75 correlate directly to the midpoint of the ranges defined below:
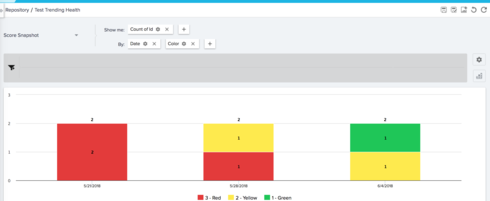
For showing counts of one color, this object works well as long as you know the midpoint of the scores you are trying to show (I.E. Count Company ID By Snapshot Date, filter Overall Score = 75), but if you group by Overall Score, you will get number buckets.
If you are on a number based system, there will be one bucket for every number, instead of just the scoring "buckets" that you have defined. Am I missing something?
View originalMy experience with the Scorecard History object is that it only snapshots the number value (even if you are on a color scoring scheme) and so the report you show in your document doesn't visually look like that when you apply those report settings. When on a RYG system, it will snapshot the midpoint of the range.
Notice 95, 85, 80, 75 correlate directly to the midpoint of the ranges defined below:
For showing counts of one color, this object works well as long as you know the midpoint of the scores you are trying to show (I.E. Count Company ID By Snapshot Date, filter Overall Score = 75), but if you group by Overall Score, you will get number buckets.
If you are on a number based system, there will be one bucket for every number, instead of just the scoring "buckets" that you have defined. Am I missing something?
1 person likes this


Reply
Rich Text Editor, editor1
Editor toolbars
Press ALT 0 for help
Sign up
If you ever had a profile with us, there's no need to create another one.
Don't worry if your email address has since changed, or you can't remember your login, just let us know at community@gainsight.com and we'll help you get started from where you left.
Else, please continue with the registration below.
Welcome to the Gainsight Community
Enter your E-mail address. We'll send you an e-mail with instructions to reset your password.