I have gathered information from various sources and compiled all values into an MDA table. For example, how many times and account did X in a certain time period. This table also contains a boolean field corresponding to each value field. If the value is greater than 0, the boolean field is True, otherwise, False.
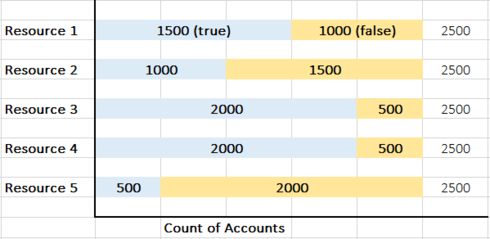
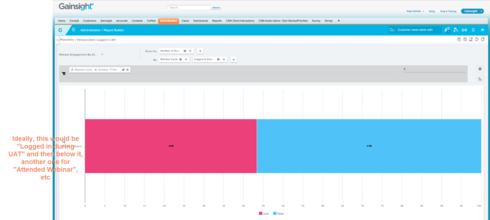
I want to use this information to create a table that shows a count of all accounts and how many are either True or False for these fields. An example mock up looks like this:
Each "Resource", as I'm calling them here, is a boolean field in the MDA table. In this example, we have 2500 accounts and they all have either a True or False value for each field. I can't figure out how to get a report that looks like this - is it possible?
Thanks for any help or suggestions!
Best answer by dan_ahrens
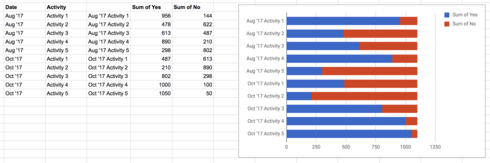
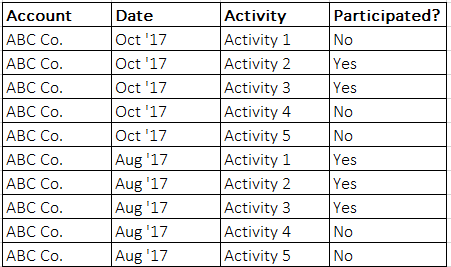
Hi Kate, would something like this work where you have a row of data for each activity type & date combination?
If so, here's how you'd do this:
Create a new MDA table to reflect the data above.
Use a formula field for the third column and use the text concatenation formula (concat) to combine the date and activity into a single field - see this link.
The concatenation is required as you can only have a single field in the "By" area when reporting with an intent to use a stacked bar as the final visualization
Use a bionic rules transform task to sum (by counting with a filter) for Sum of Yes and Sum of No fields - see this link
Use a load to MDA setup action to write this aggregated data to your new MDA table
In the report, use the new MDA table as the source and add the concatenated date and activity field you created to the "By" area and the two new sum fields to the show me. This should give you a table of data that would allow you to create a stacked bar chart.
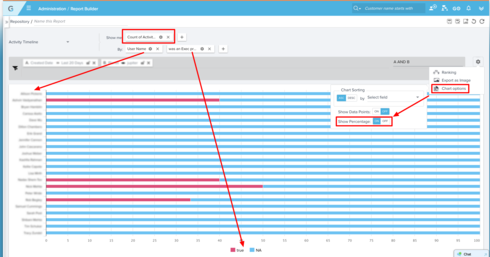
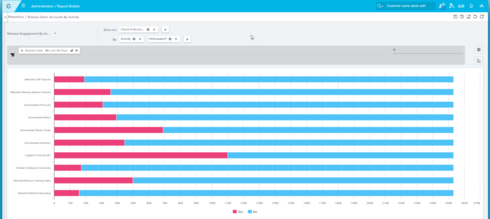
Hi Kate, this is definitely doable with Gainsight Reporting. I've included a sample below of a similar report that I just mocked up using Timeline as a data source.
Please note the following:
You'll need two aggregations in the By: section. The first will be the left hand column data (in this case User Name) and the second will be your boolean (we have a Y/N field denoting exec presence on the event).
Your Show: field will be the data that you want to "count" - in my example it's the number of activities but in your example it would be the Accounts
Select Stacked Bar as the visualization and to get full width percentages, select chart options and Show Percentage.
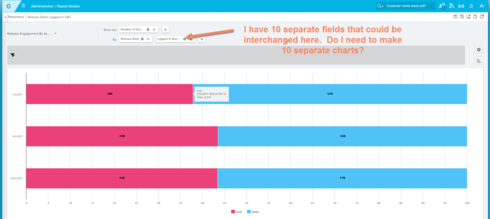
Thanks Dan! This has helped me move forward, though not completely. There's one more piece to this. I have 10 separate things that I want to track, for example:
Did they download a resource
Did they attend a webinar
Did they watch a training video
These are all separate fields in the MDA table. For each time period (quarter), each account has 10 true/false values associated. I don't want to have a new line in MDA for each combination of Quarter and Boolean Value.
Is there any way to include all of these fields on one chart?
I want to make sure I'm understanding the reporting need thoroughly. Help me out with these assumptions and let me know if any are incorrect:
The Y-Axis represents product release dates and you are aggregating all customers within that given calendar quarter into two groups using the X-axis boolean field
The data that you are tracking using the boolean is a single dimension question such as "did they attend a webinar"
You have 10 total Y/N questions that you want to summarize by quarter in this style of report
It sounds like you want to combine all of the 10 dimensions into a single "group by" visualization such that instead of each customer only having one possible state (1,0) or (0,1), they will sum the total of the 10 dimensions into an array where some possible states per customer could be (9,1) or (5,5) or (2,8) etc
Is this correct?
One follow up question - would it not be valuable to show did data broken out where there is a report per dimension so that you can see the impact of the various activities (webinar, downloaded resource, training video, etc)?
Another alternative would be to show all 10 dimensions on a single report, but you could only report on a single release date at a time.
Let me know if this helps or alternatively I'd be happy to jump on a call to work though the details in person. Shoot me a note at dahrens at Gainsight dot com if you'd like to discuss further.
One other point I'll add is that it often helps to start with understanding how your data will look in a table (as all visualizations are representations of data that starts in a table). That can help you determine what your columns and rows would be and how you would group them.
The Y-Axis represents product release dates and you are aggregating all customers within that given calendar quarter into two groups using the X-axis boolean field
I set up the chart in the above example using Release Date (just to get a better feel for the group by and how that would affect the chart) but really I just care about the latest release date:
The data that you are tracking using the boolean is a single dimension question such as "did they attend a webinar"
Yes, and I also have a corresponding number field which tells me how many webinars they attended, videos watched, etc in the time period.
You have 10 total Y/N questions that you want to summarize by quarter in this style of report
Yes
It sounds like you want to combine all of the 10 dimensions into a single "group by" visualization such that instead of each customer only having one possible state (1,0) or (0,1), they will sum the total of the 10 dimensions into an array where some possible states per customer could be (9,1) or (5,5) or (2,8) etc
Yes, some accounts will have done some of the 10 activities, while others may have done a different combination. But I want to show "Out of all of our 2500 accounts, how many did X, how many did Y, how many did Z" - not really caring to know the names of the accounts.
In response to your last comment:
Totally understand. I think in order to get what I want, I'd need a table that looks like this:
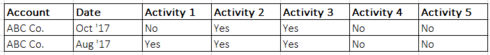
However, what I currently have is this:
I just need to decide if I want to transform my table into the one above, right?
Hi Kate, would something like this work where you have a row of data for each activity type & date combination?
If so, here's how you'd do this:
Create a new MDA table to reflect the data above.
Use a formula field for the third column and use the text concatenation formula (concat) to combine the date and activity into a single field - see this link.
The concatenation is required as you can only have a single field in the "By" area when reporting with an intent to use a stacked bar as the final visualization
Use a bionic rules transform task to sum (by counting with a filter) for Sum of Yes and Sum of No fields - see this link
Use a load to MDA setup action to write this aggregated data to your new MDA table
In the report, use the new MDA table as the source and add the concatenated date and activity field you created to the "By" area and the two new sum fields to the show me. This should give you a table of data that would allow you to create a stacked bar chart.
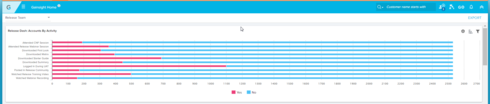
Do you mind showing the report screen that has the Show Me and By areas? I think this would be helpful for any other community members who might have a similar use case. Seeing how your report was structured can give them ideas on how to build their own.
Here you go! I have Count of Account Name in the aggregated Show me field and then Activity and Participated (yes/no) as the Group By fields. I used a filter to show me last 90 days, so this will update with each release.
If you ever had a profile with us, there's no need to create another one. Don't worry if your email address has since changed, or you can't remember your login, just let us know at community@gainsight.com and we'll help you get started from where you left.
Else, please continue with the registration below.
We use 3 different kinds of cookies. You can choose which cookies you want to accept. We need basic cookies to make this site work, therefore these are the minimum you can select.