New Idea

How to show totals in a chart report

Related products:None
  • December 2, 2020
  • 3 replies
  • 116 views

andorfuhrer

Am I going crazy, or is there not a way to show totals in any of the graph reports in Gainsight?  I am not seeing it in any of the options, am I missing something? 

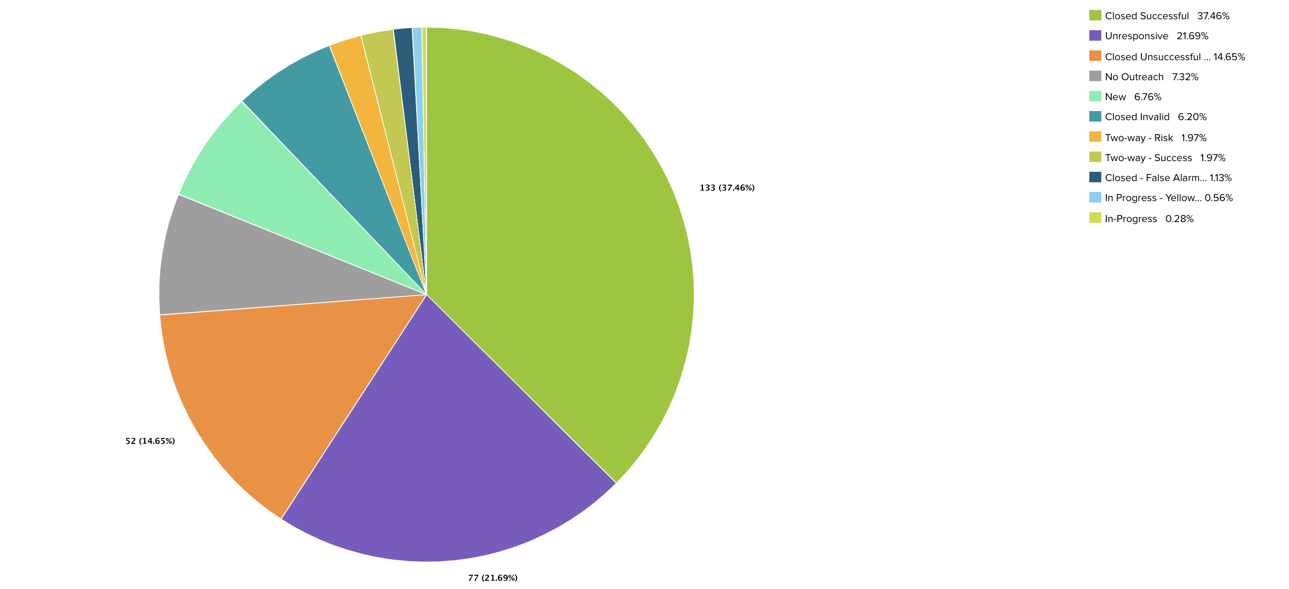
If I click show data points, I only get some of the data points in the graph (thats a whole other topic) but how can I see the total number for this pie chart?  

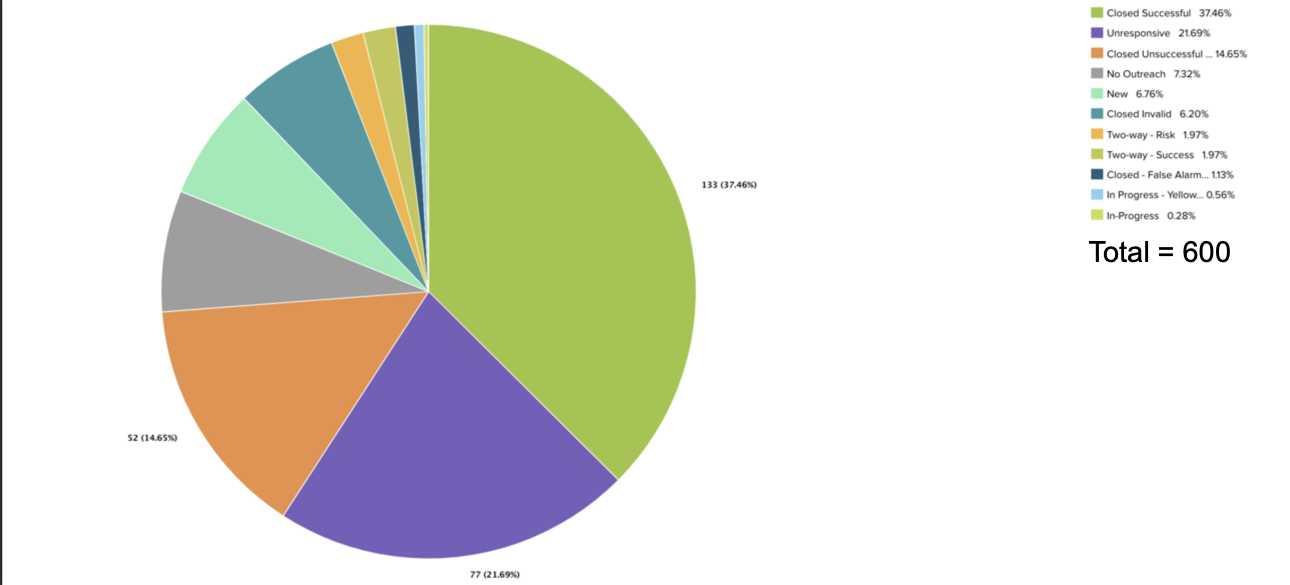
My workaround has been to create a widget to show a total and then have a corresponding pie chart.  That was working but stakeholders wish we could hit two birds with one stone (sorry PETA) and have one report to show both totals and breakdown.


3 replies

sai_ram
Forum|alt.badge.img+1
  • Expert ⭐️⭐️
  • 3727 replies
  • December 3, 2020

@andorfuhrer sorry for the inconvenience! We are in a process of revamping the Pie chart functionality in near term. Thanks!!

Changing this to idea post.


rakesh
Forum|alt.badge.img+1
  • Lets put your data to work!
  • 835 replies
  • December 18, 2020

Hi @andorfuhrer 

Is it possible for you to visually demonstrate how that would look like? This is a non-standard request for visualizations IMO! 

I dont think even if we give that data when you hover on a field, it wont 100% solve what you are looking for.


andorfuhrer
Forum|alt.badge.img+1
  • Author
  • Helper ⭐️
  • 36 replies
  • December 18, 2020

@rakesh -  Im thinking for a pie chart - something like this.  At the bottom of the breakdown, I would be able to see the total.  I think in a pie chart it may not make sense -

but if you have a pivot it would make more sense to have a total.  In this example, having total at the bottom and the right hand side of this report would be SUPER helpful


Reply


Cookie policy

We use cookies to enhance and personalize your experience. If you accept you agree to our full cookie policy. Learn more about our cookies.

 
Cookie settings