Hello,
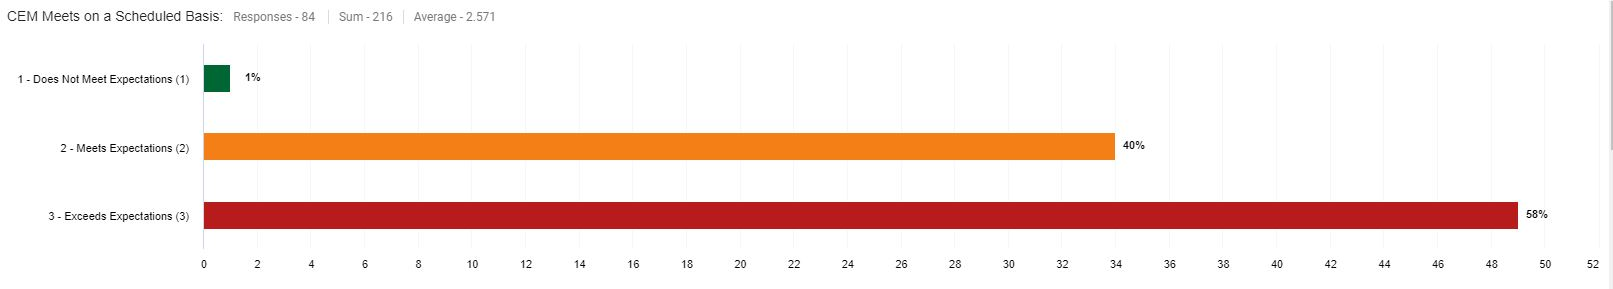
I would like to be able to change colors on graphs for the Response Report under Surveys 2.0 analyze. I’ve learned from support this isn’t possible. Please see screenshot where a response of “Does Not Meet Expectations” is green and “Exceeds Expectations” is red. I would like to reverse these.