
Understanding how your community engages, grows, and evolves shouldn’t feel like guesswork. That’s why we’re excited to announce that our Data Connectors are now widely available, giving you direct access to your community data for deeper analysis and reporting.
What are Data Connectors?
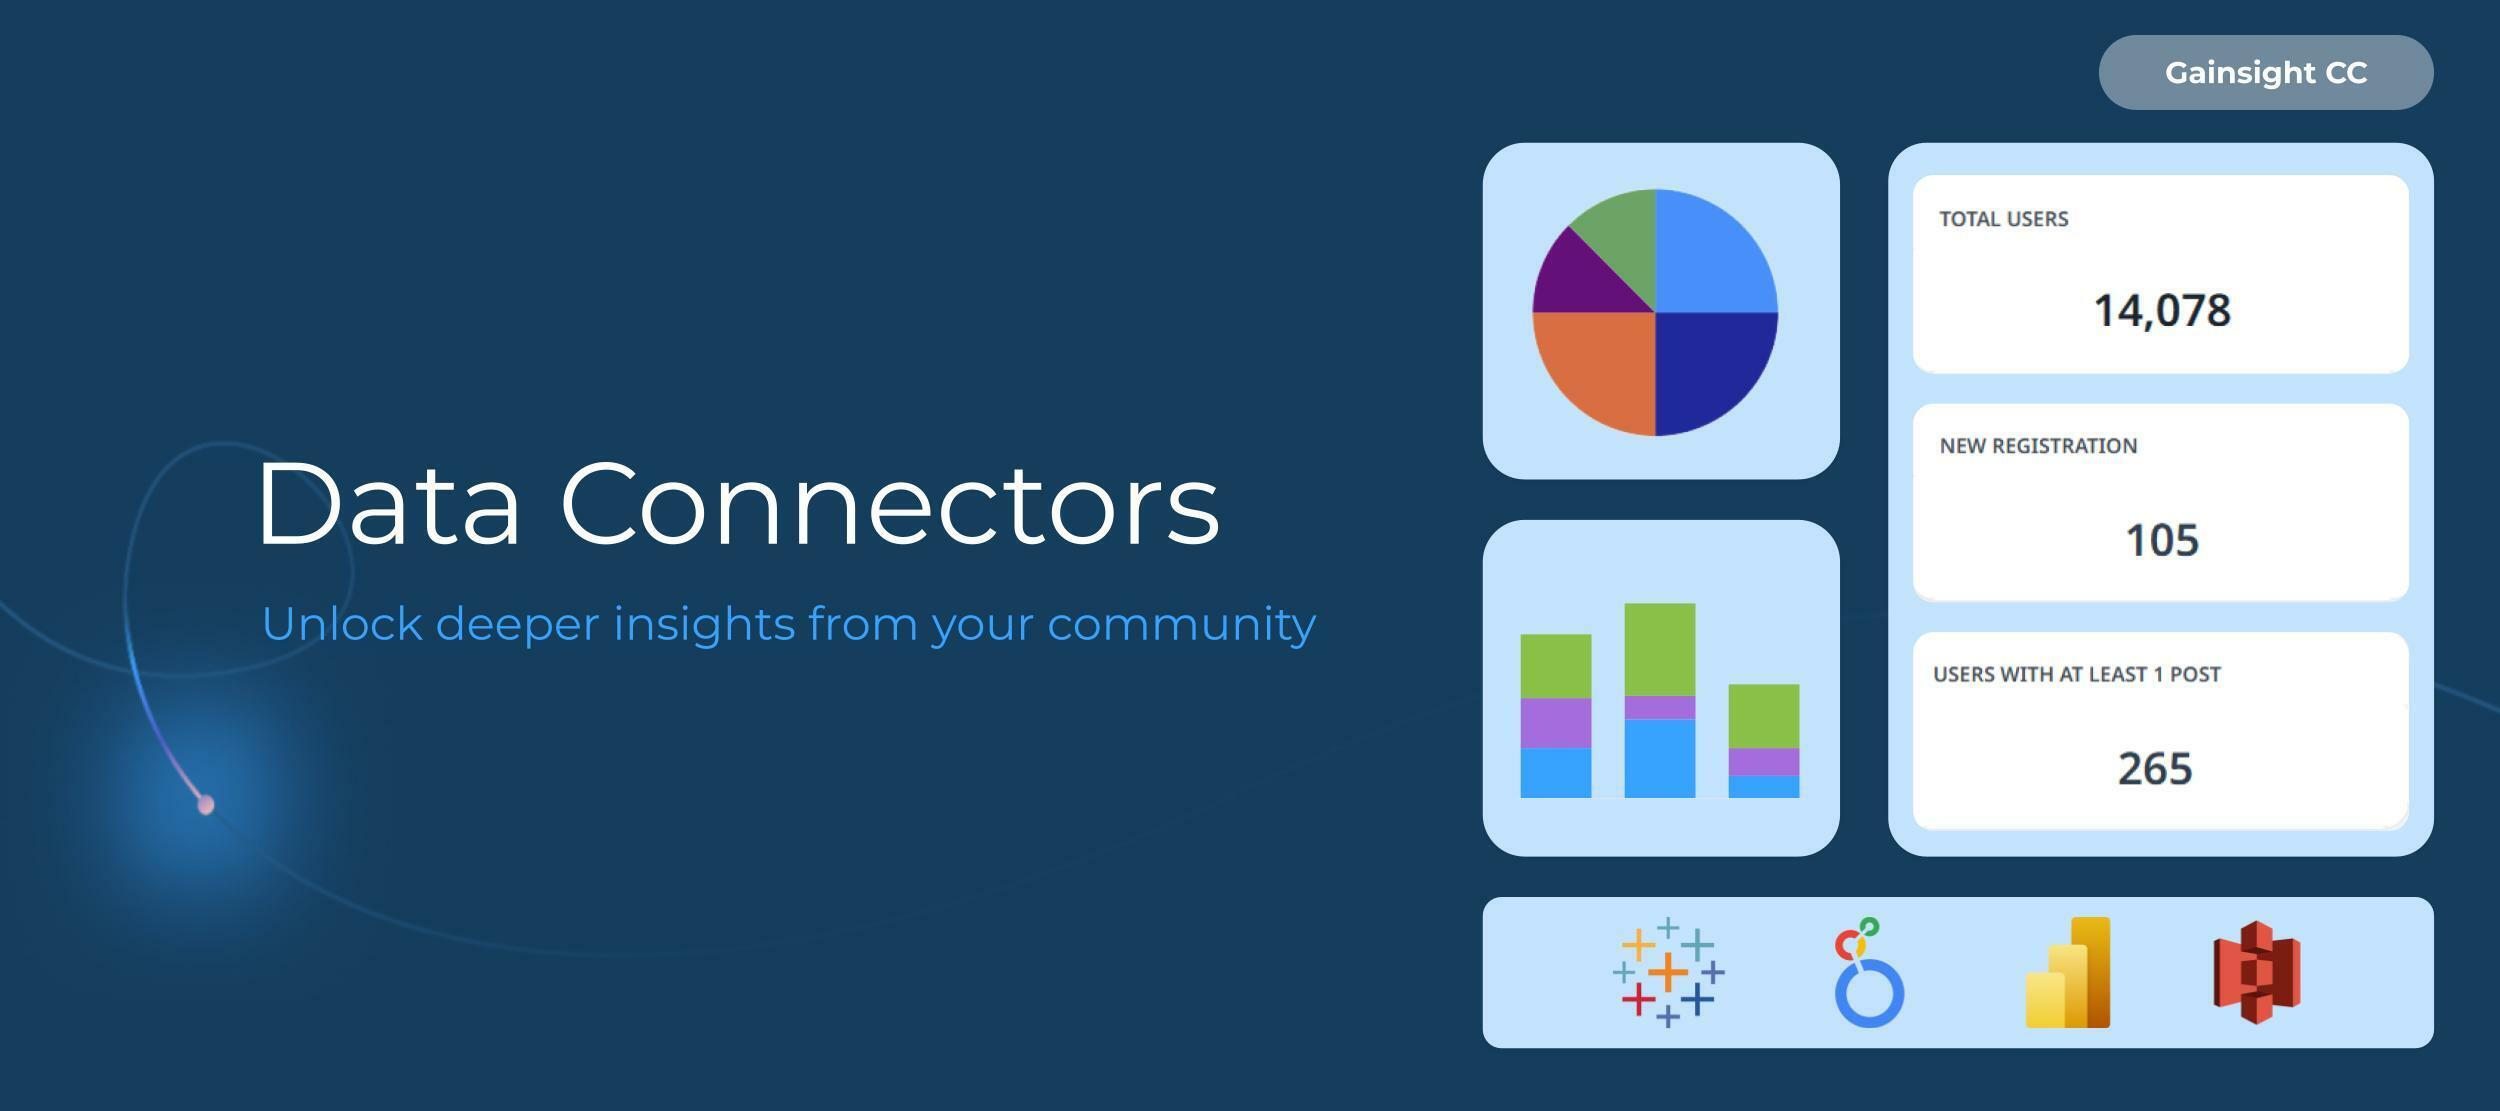
Data Connectors provide a direct pipeline between your community data and your Business Intelligence (BI) tools, allowing you to track engagement, analyze performance, and uncover trends with ease. Whether you’re monitoring content success, visualizing key metrics, or blending community data with company-wide analytics, these connectors make it simple to turn data into insights.
What You Can Do with Data Connectors
- Track Community Engagement & Performance – Analyze content performance and post activity, track user participation and engagement, and discover trends to get a holistic view of your community’s dynamics and understand what’s working.
- Build Custom Reports & Dashboards – Connect to your BI tools like Power BI, Looker, or Tableau to create reports tailored to your business needs. Visualize and share community data with interactive dashboards.
- Merge Community & Company Data – Use the S3 connector to copy data into your preferred data warehouse (e.g., Snowflake), making it easy to combine community insights with your internal analytics and providing a complete picture of customer engagement and performance.
How to Get Started
It’s easy to connect your data! In Control, go to Integrations > Apps, where you’ll find four Data Connectors: Power BI, Looker, Tableau, and S3. Select your preferred tool, follow the integration steps, and start pulling in your community data to build the reports and insights that matter most to your business.
For more detailed steps for your specific BI tool, check out this page.
With Data Connectors, your community becomes a valuable source of business intelligence. Ready to explore the possibilities? Log in and get started today!