Ability to sum a column in Tabular Reporting AND create formulas
 +1
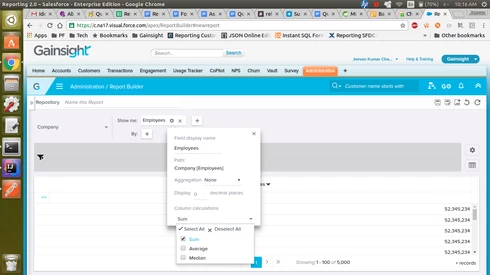
+1It would be awesome to be able to create a tabular chart in reporting and see a sum at the top of the column(s). And/Or allow us to show subtotals and grand totals like you can in SF. It would also be wonderful to have the ability to create calculated fields right on the chart like % of cases open per month, etc.
Sign up
If you ever had a profile with us, there's no need to create another one.
Don't worry if your email address has since changed, or you can't remember your login, just let us know at community@gainsight.com and we'll help you get started from where you left.
Else, please continue with the registration below.
Welcome to the Gainsight Community
Enter your E-mail address. We'll send you an e-mail with instructions to reset your password.