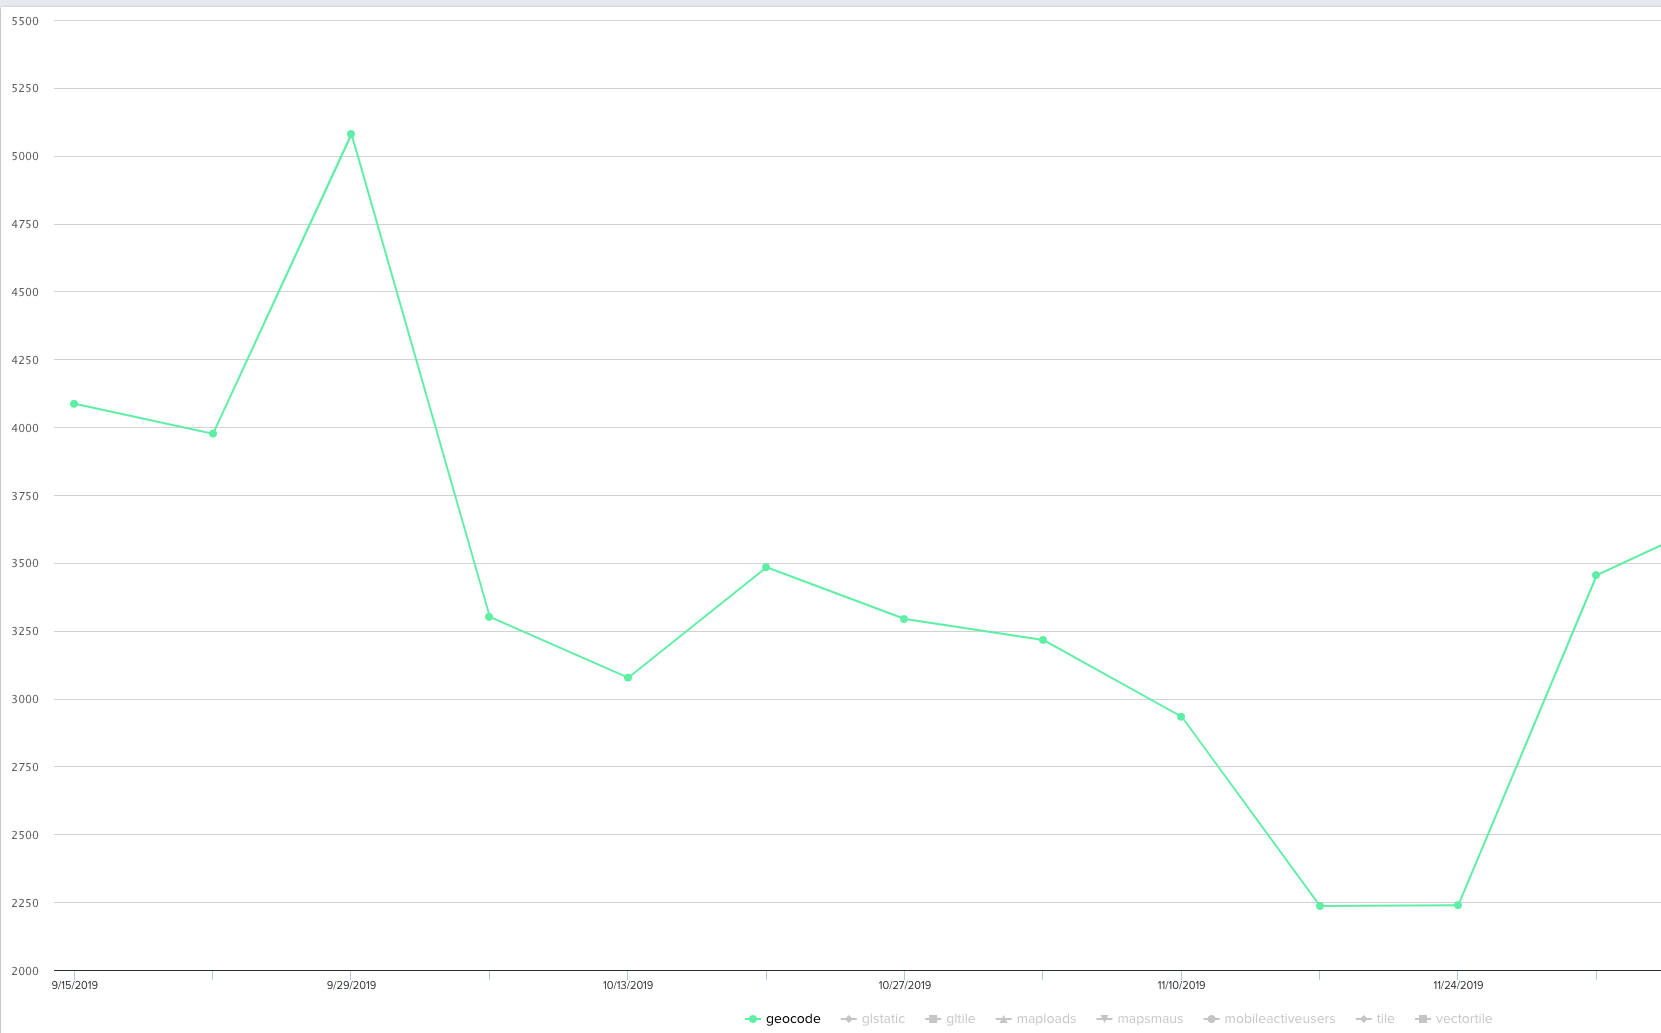
Add ability to click-to-filter for series in graph

  • January 10, 2020
  • 2 replies
  • 26 views

Forum|alt.badge.img

Adoption Explorer has nicer looking reports, however, I’m facing an issue when displaying multiple series on a line chart:
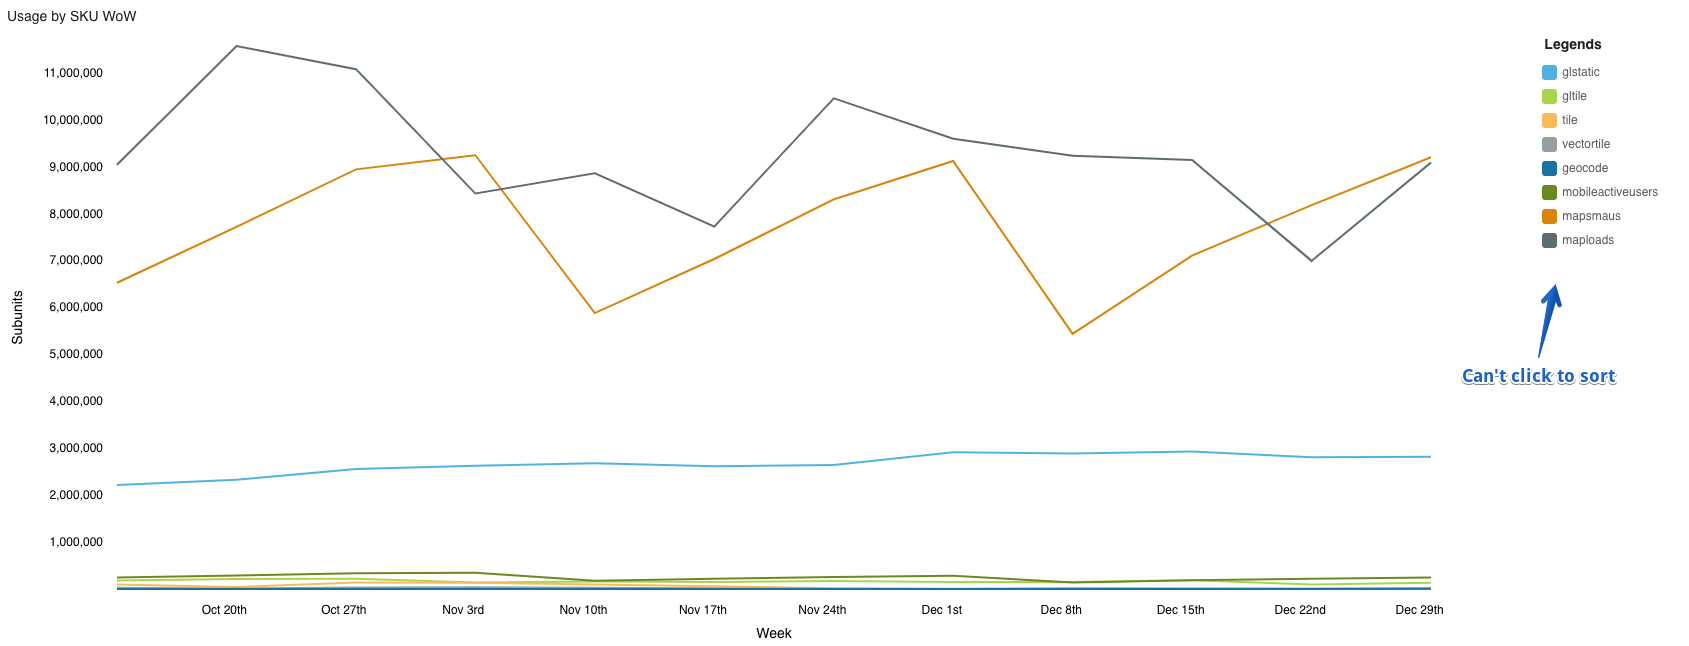
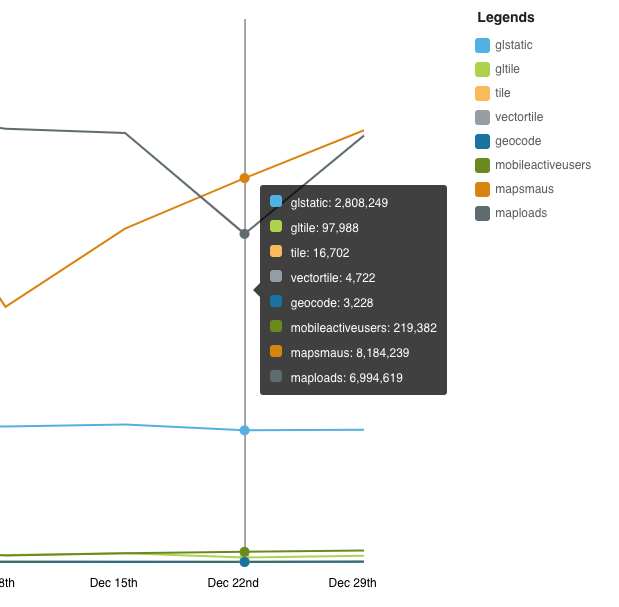
The issue is when you have series with vastly different scales. It is difficult to understand the relative value of sort series as is. There is a nice detail pop up when you hover over a data point, but this is still a little difficult to use:


In the standard Gainsight reports, you can click to filter which solves this issue:
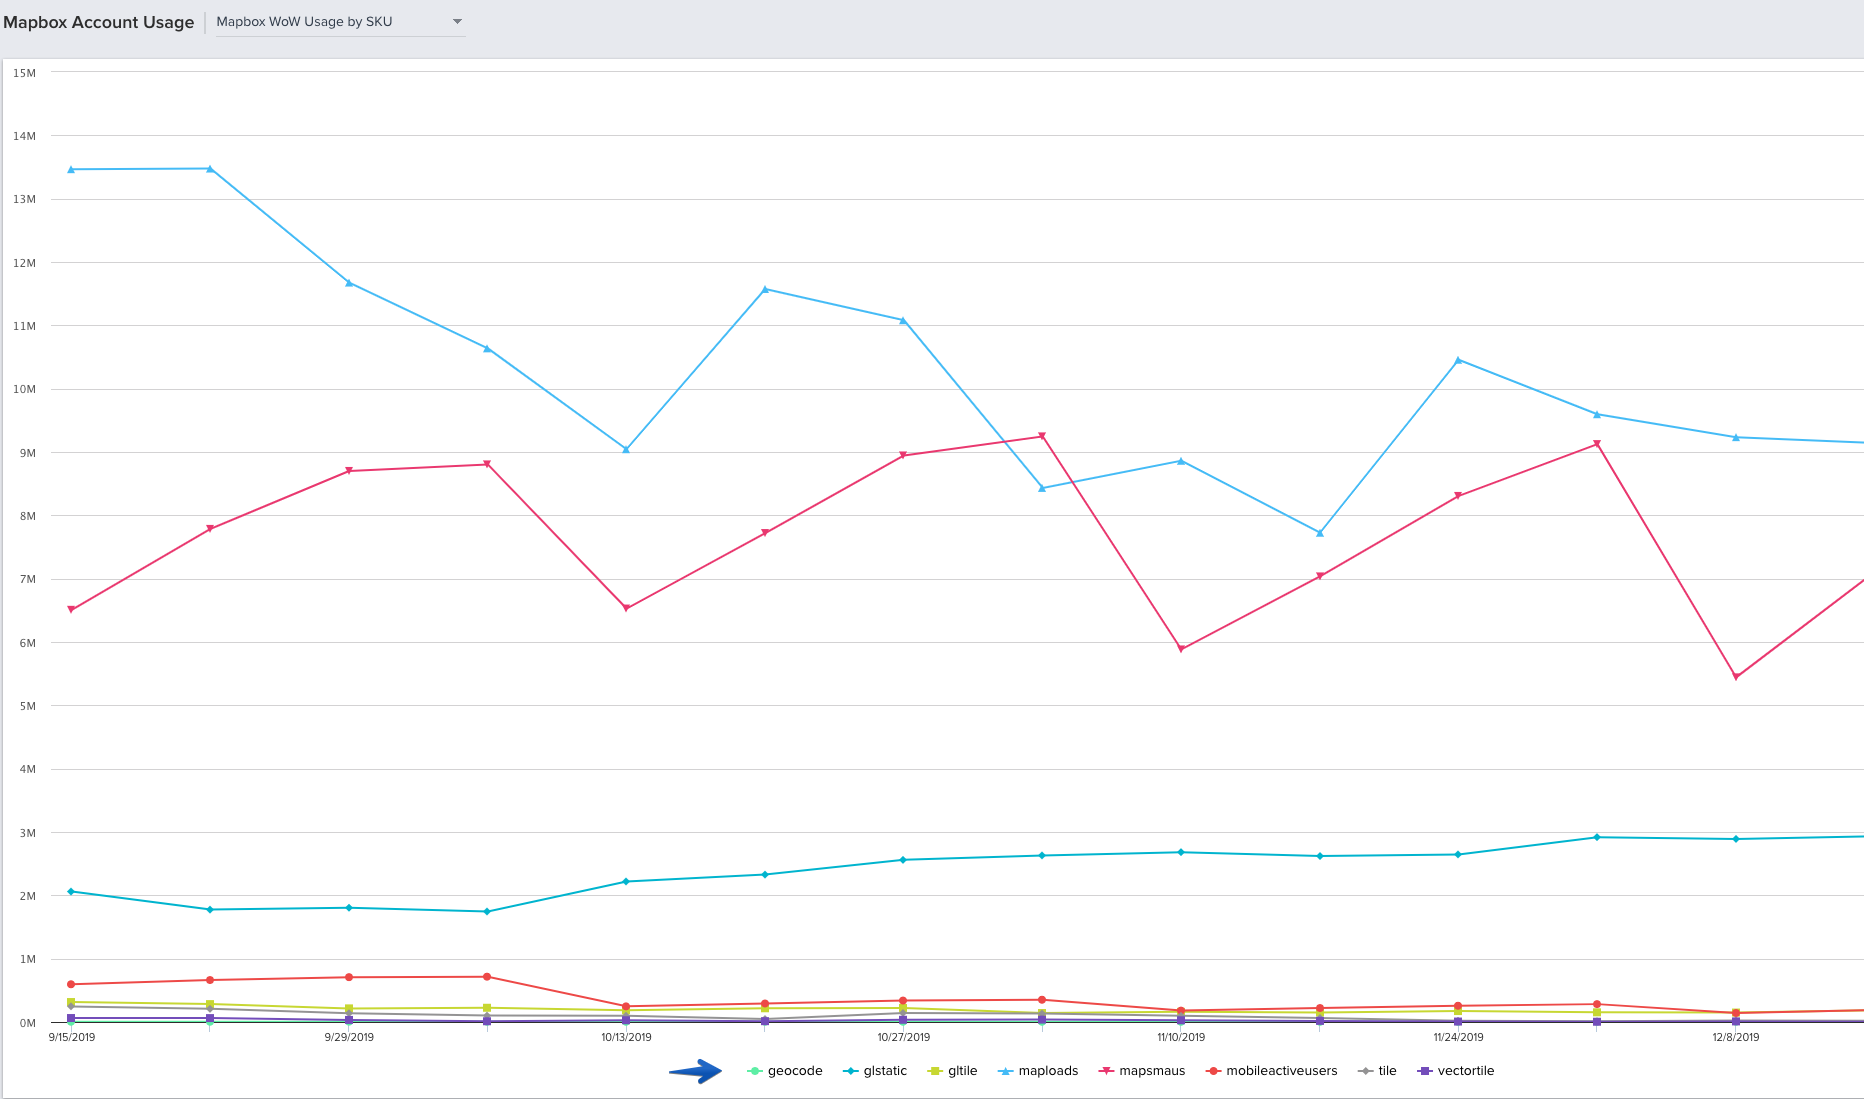
Click on the specific series to quickly filter
Filtered version

This feature that exists in standard reporting has been one of the most useful when embedding reports in C360. Hopefully, this is something that you can add to a future release :)

2 replies

skalle
Forum|alt.badge.img+1
  • Gainsight Employee ⭐️
  • February 17, 2020

If the usage trend report was built on multiple measures and if we want filter showing only some measures, there is feature called “Selective Measures” which allows you to filter showing limited trends based on selected measures to address this use case. Can you please let me know if this helps your usecase?


sai_ram
Forum|alt.badge.img+1
  • Expert ⭐️⭐️
  • September 28, 2020

If the usage trend report was built on multiple measures and if we want filter showing only some measures, there is feature called “Selective Measures” which allows you to filter showing limited trends based on selected measures to address this use case. Can you please let me know if this helps your usecase?

@jpmehlhaff did the above comments help you? Please lets us know if you need any help here.