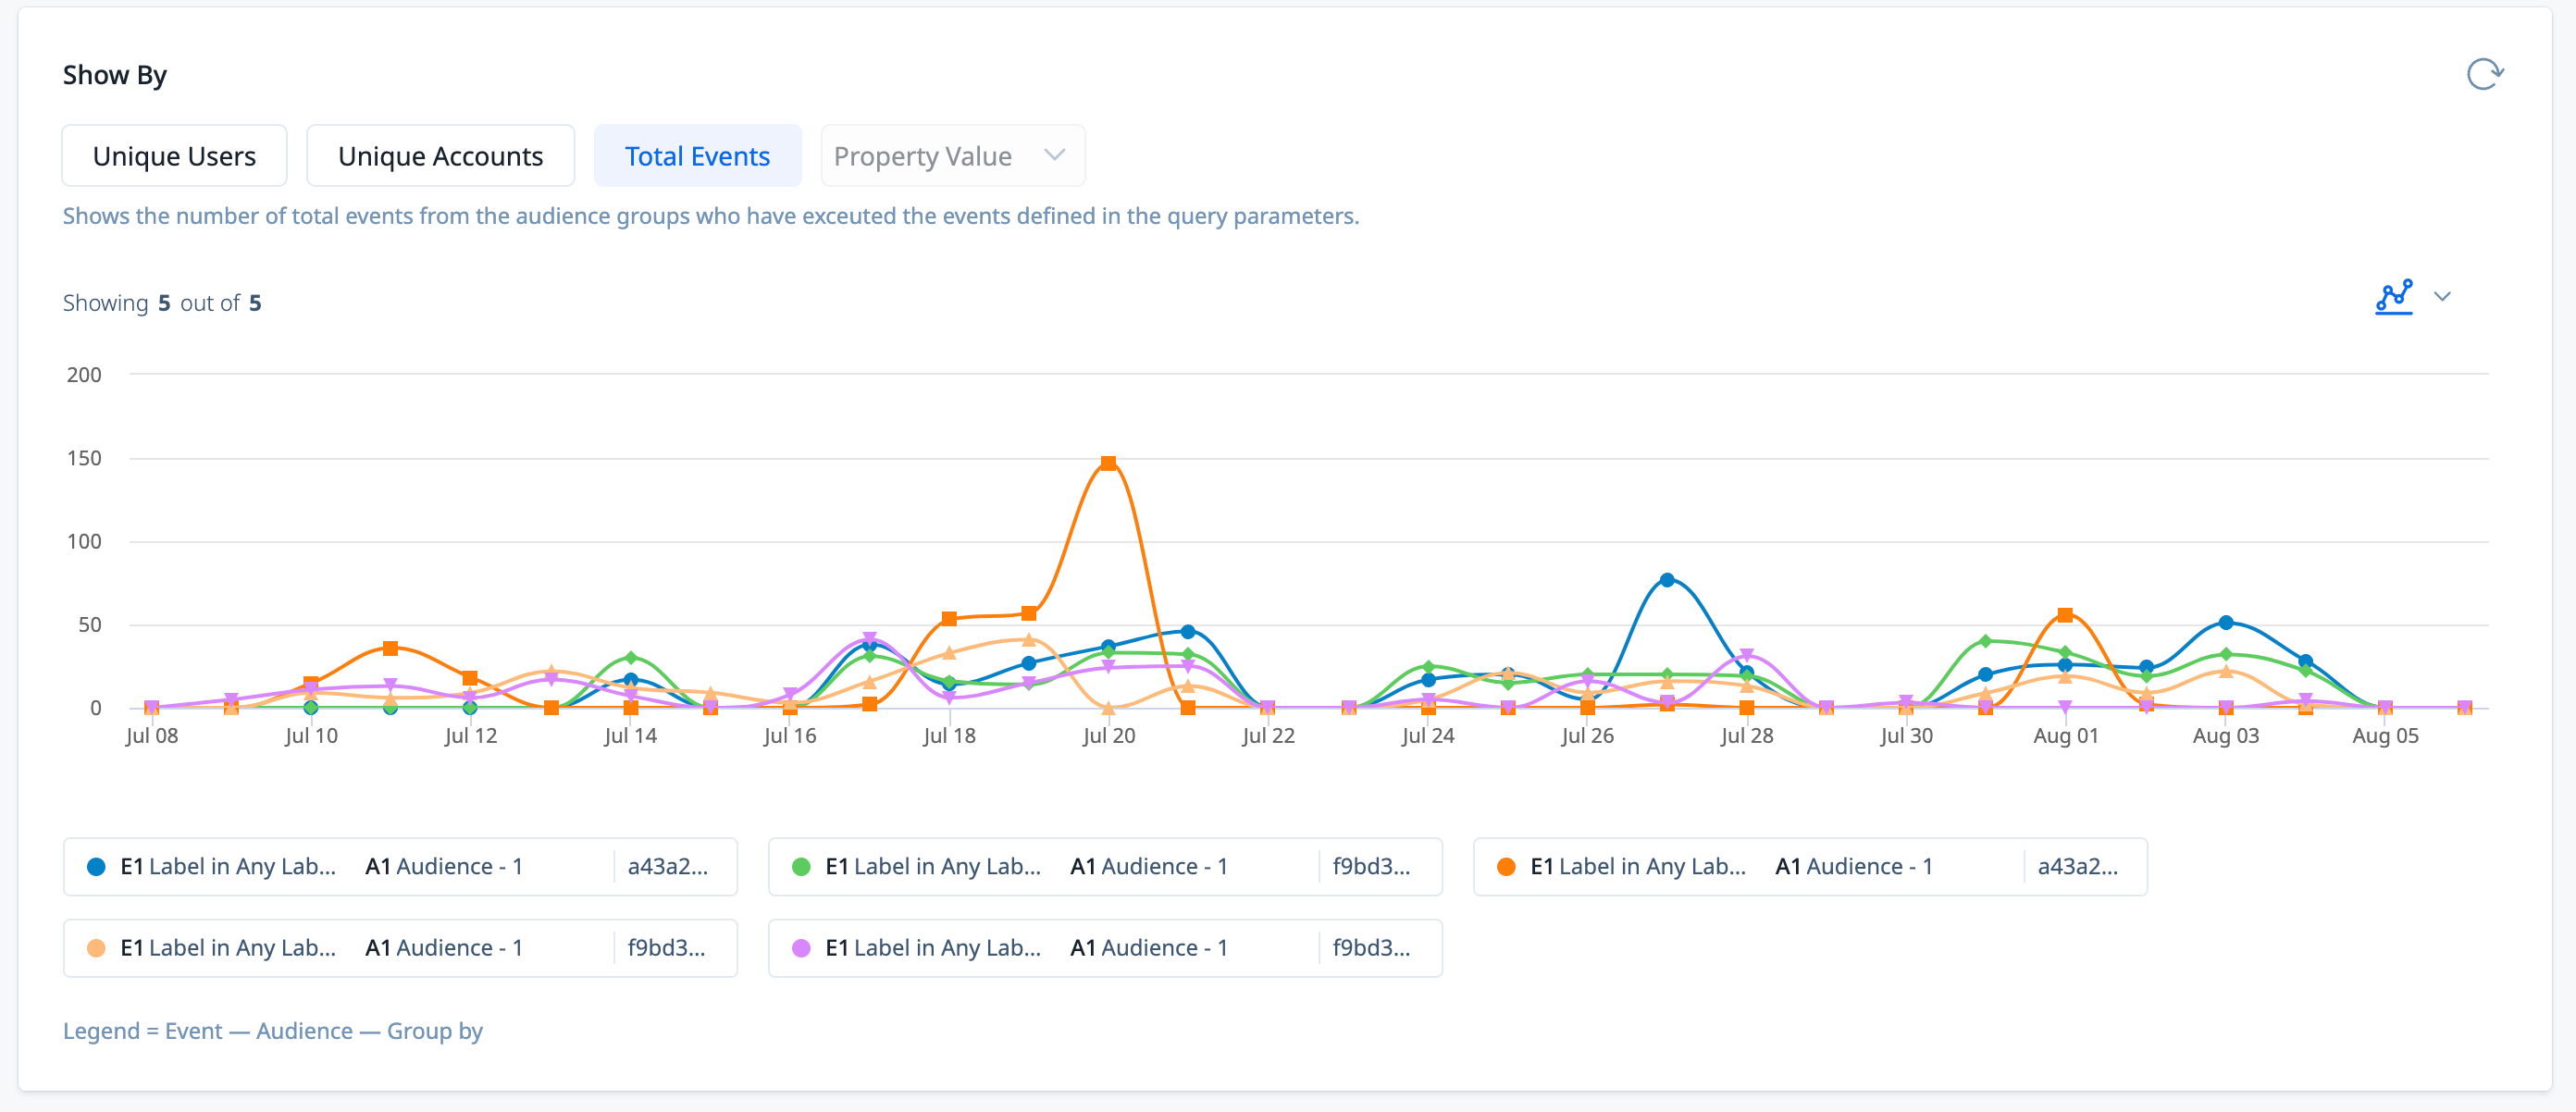
I want the ability to see in one screen all users and what features they’ve used over a selected date range. Right now I see high level usage statistics at a company level, or granular data at the individual level, but there’s no way to group the data by all users in one company and corresponding features.
Cohort Usage data by User

Sign up
If you ever had a profile with us, there's no need to create another one.
Don't worry if your email address has since changed, or you can't remember your login, just let us know at community@gainsight.com and we'll help you get started from where you left.
Else, please continue with the registration below.
Welcome to the Gainsight Community
Enter your E-mail address. We'll send you an e-mail with instructions to reset your password.